Graphical power bar extension

Hi,
I tried my hand at adding another small feature to the Karoo that I missed when switiching to the Karoo from a wahoo computer: A graphical display of your current power output / HR that you can easily read at a glance while riding. Wahoo devices have dedicated LEDs for that, but the Karoo has a good screen that could just show a bar at the edge. Using the new SDK, I added that as an overlay window:

The nice thing about such a solution is that it does not take up a data field on the map page. The overlay bar is implemented using the same android API used by messengers to show chat bubbles on top of other apps on your phone. It is set up to not catch touch events, so swiping up during riding should continue to work as expected.
Find the code and APK to sideload at https://github.com/timklge/karoo-powerbar . I would appreciate feedback on whether it does work on your device and if the contrast is sufficient so that it is easily readable at a glance (The bar is semi-transparent which is enforced by android because it is untouchable). I only tested it on my Karoo 3 and an android emulator that runs the android version of the Karoo 2, so it should work on there too.

-

Hi! I tried out your extension on my K2 on Sunday, configured only for HR, I think it's not exactly the same as I see in these screenshots, maybe an earlier version (v1.0.0).
First of all, great job, you got an incredibly clean way to show HR and Zone in a very small screen space, a thing that surely is very appreciated by all karoo users. Congrats!
Two comments (maybe will change with the new versions):
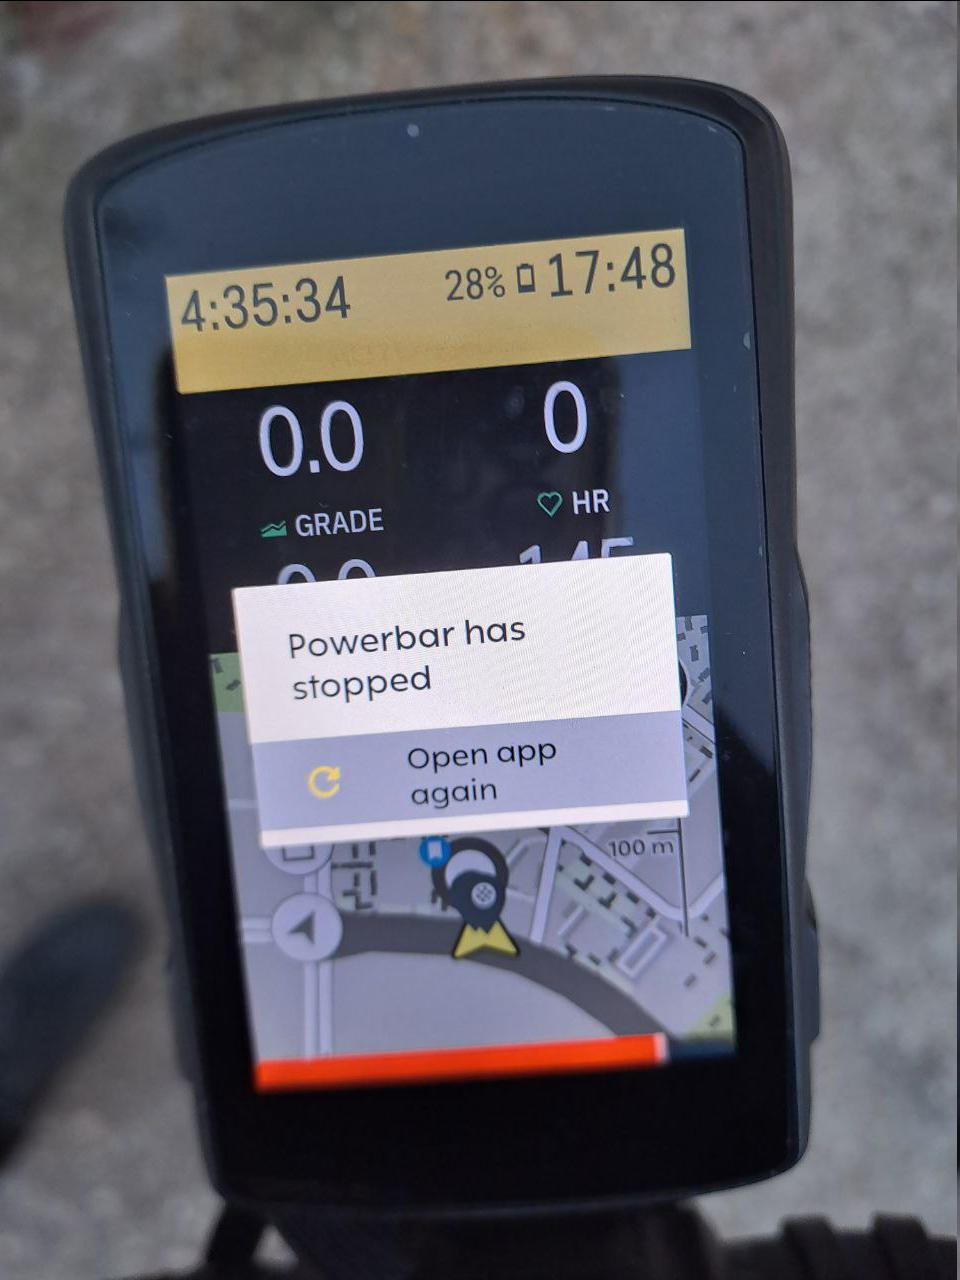
1) Powerbar failed sometimes, seems that only when HR was high (red coloured bar):
2) A visualisation impact on Climber segments % info:

I will download the current version for the next ride, and see improvements! 🙂
Again, very good job, thanks for sharing it.
Best regards.
-

This is good work! I will check it out.
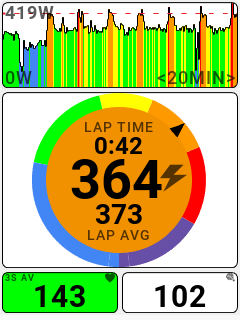
Would you ever consider building out a more robust graphic data field for Power and HR? I'm attaching a screenshot from another computer (Stages L200) that I would consider best-in-class for this type of thing. The top chart is power but can also display HR. The big gauge widget in the middle is power (but can also change to HR) and is probably the single best graphical display for power-based training that I've ever seen.
-
Hi,
thanks for the kind comments :-)
@Fernando: Sorry, I made a mistake regarding the configured hr zones in the first version of the app. I set up one hr zone too few so the app crashed if you got into the highest one. That is fixed in version 1.0.1 onwards. I also shrunk the bar a bit (and added the number value field on top in version 1.1.0), maybe that is already sufficient so that enough of the climber percent indicators is now visible for them to be readable. I will check that during my next outside ride. Many thanks for testing!
@Scott: Those look interesting, and it would certainly be possible to implement them using the new SDK. But I would consider it out-of-scope for this extension currently - my goal was to replicate the functionality the wahoo led bars provide on that computer, and free up data fields on the map page for other uses.
-
Tested today on my Karoo 3 and worked great. Only thing i noticed and wanted to check is that the HR seems to be the instant HR (no averaging) but power seems to be maybe a 3 second average since it never quite matched the instant power number in the standard data field. Does that sound right?
Also, sorry for kind of hijacking the thread on my last post. I should know better. Thanks for your work on this!! -
Actually, the default setting is supposed to be instant power, so your power data field and the bar should show exactly the same value. You can select the bar to use the 3 second or 10 second average power values in the settings accessible from the main menu.
I have not been able to test the extension during an outside ride with a power meter yet; during indoor ride testing it displayed the correct values read from my smart trainer. I will test it outside and check if the values match when the weather gets better around here.
-
I pushed a new update to github (version 1.3) that allows to use display speed or cadence in one of the bars. It also adds a setting to set the size of the bars (small, medium, large). Using small bars and with the number value display turned off, obstruction of the climber widget or other karoo system UI should be minimal.
-
Thanks! I've pushed an update to version `1.4.0`:
- Make bar background transparent by default
- Add separate settings for font size, bar size
- Add route distance data source
- Add workout target indication
The main new feature is a workout target indication on the bar if you have a workout loaded:
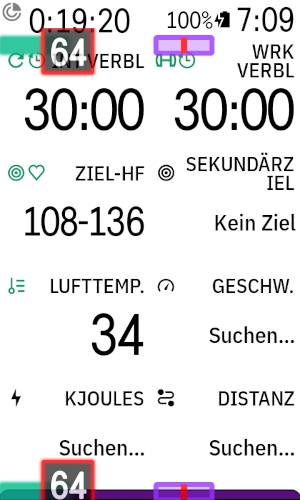
The label box and target indicator are colored red if you are missing the workout target, and green if you meet it
-
I've pushed an update to `1.5.0`. There's now the option to use the current grade as a data source for a bar, and you can split each bar into two:
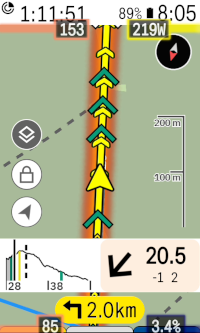
So you can now display 4 bars on the screen; or if you don't like the bottom bar because it obstructs the climber drawer, you can have 2 bars at the top.


Please sign in to leave a comment.
Comments
16 comments