Upcoming elevation graph: What's the number in the top-left?
Answered
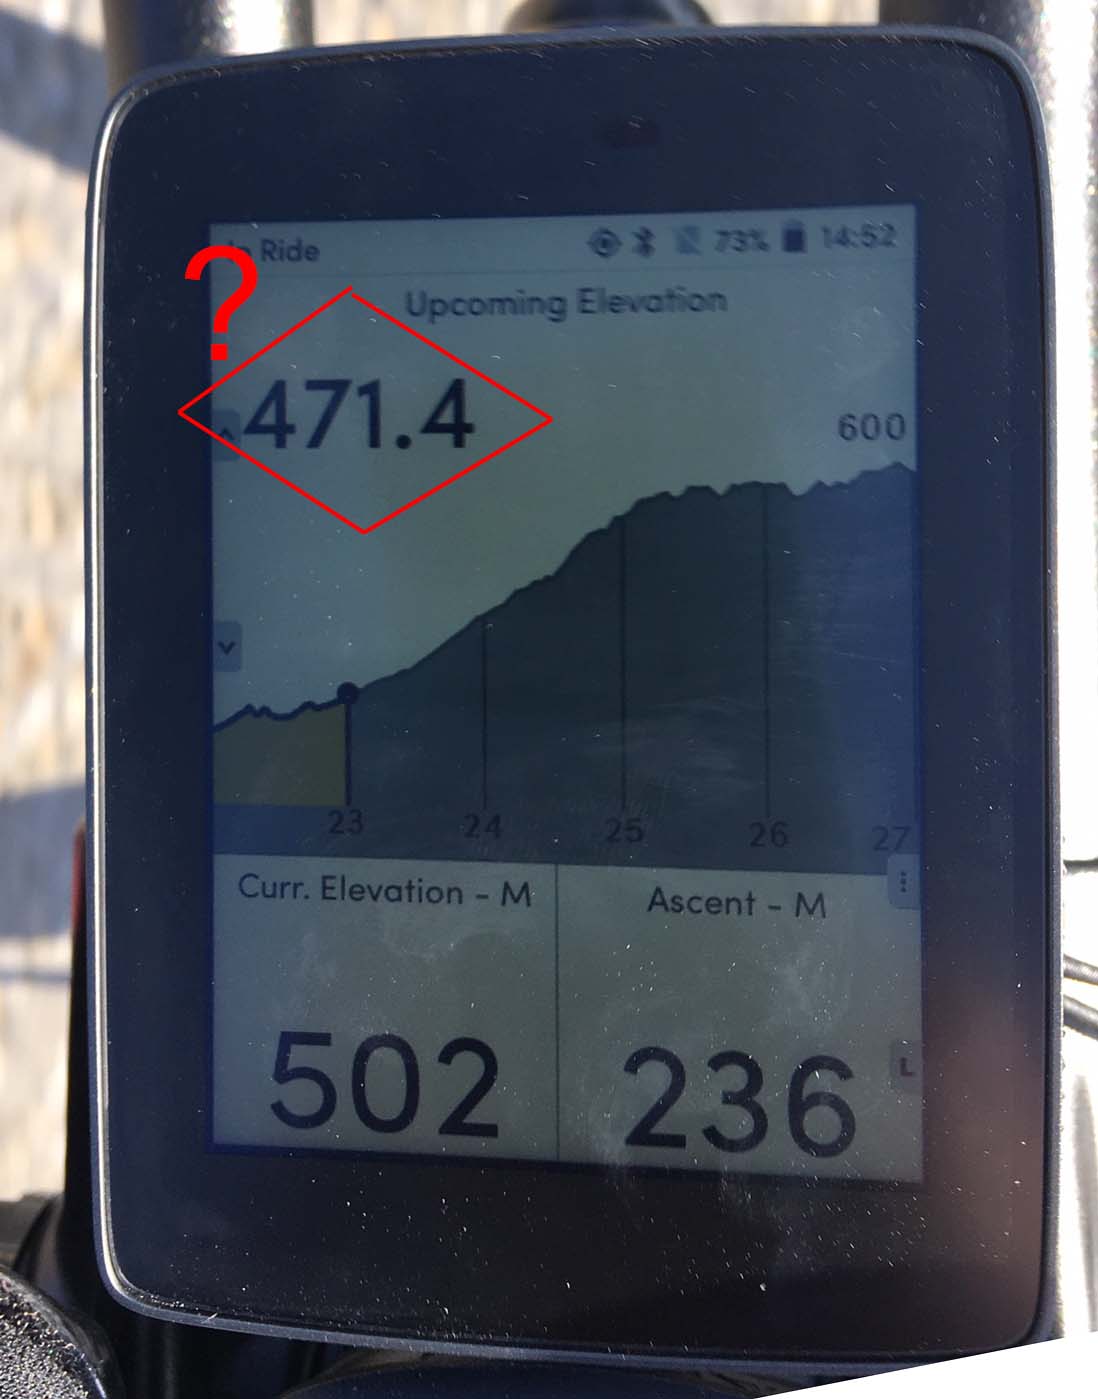
I have 3 questions and a proposal about the value in the top-left of the upcoming elevation graph, which I've highlighted with a red diamond in the image below (471.4):
1. What does the value represent? I had a few theories, but during my testing none of the good ones seem to be correct. My best remaining guesses are that it's the average elevation over the previous couple of kms or the elevation at the very left-hand side of the chart, but I don't see why either of those would be shown on the upcoming elevation chart when those value more belong more on the historic elevation chart (and even there it would be pretty pointless information to have).
EDIT: After much sleuthing and theory-testing I've finally discovered that the value shows the GPS-derived current elevation. This differs from the Current Elevation shown in the other data fields and the Historic Elevation chart because that value is based on the barometric-elevation (which may be slightly mis-calibrated/less precise but it is more reliable).
2. Why is the value so big/prominent? I've pretty much decided that whatever it means, the information is not very useful or important, so why is it displayed so prominently? Maybe the answer to Question 1 will help here.
EDIT: Having figured out the answer to Q1, I can now see that it is appropriate to show the current elevation on this chart, and the GPS-derived version of the value is more appropriate because it is more likely to be consistent with the data shown in the Upcoming Elevation chart than is the barometrically-derived elevation.
3. Why is the value so precise? Even current elevation is only displayed to the nearest meter. Regardless of what the value represents, I'm sure that an accuracy of 0.1 meters is unnecessary and the data is not precise enough to warrant it. I'd also be happier if the value was followed by units, I assume it's an elevation and so it should be meters or feet.
EDIT: I still cannot see any value of showing this to the nearest 10 cm - that part of the value is mostly unreliable noise; rounding to the nearest meter would make a lot more sense.
4. I can think of many more useful things to put here, like the expected average gradient over the next upcoming 500 meters, or something similar. Having a precision of 1 decimal place could be useful there, or maybe just rounded to the nearest 0.5% because again the data isn't precise enough to warrant anything more.
EDIT: I can now see the logic in presenting this value here, however the value that I proposed, the average gradient over the next 500 meters would also be very useful.
Please enlighten me, because it's really bugging me now, I spent a whole ride trying to figure it out and cannot find it mentioned on your support pages.
-

Good question.. btw it's not possible to zoom in/out or move forward/backward to check the full track.
About point 2, this number is very annoying when you are going down and it cover the graph. It may be useless if you can use the flields at the bottom, but let's wait for the answer...
-

Hi Chris,
I completely understand your concern. For your first three questions, I hope this link gives you more insights into the upcoming elevation and its significance. We try to make it as precise as possible. https://support.hammerhead.io/hc/en-us/articles/360030418353-Feature-Showcase-Upcoming-Elevation-Graph
For your 4th question, I am definitely forwarding your feedback to the software team.
-
Was my question not clear enough? Was my red diamond not obvious enough? I already read the page you linked to before I posted this question, but had to make this post because I could not find the answer there.
Please look at my example again: the current elevation was 502 meters and the graph shows that the elevation is only going to increase during the next 5 km. So what does "471.4" mean? It can't refer to any upcoming elevation that is relevant any time soon. In fact, that route stayed above 500 meters elevation for the next 40-50 km.
Please respond to my question rather than linking to a page that looks like it will contain the answer, but doesn't. Thanks.
-
Hi Chris,
The digits that you marked in red diamond is the upcoming elevation of the route ahead. The default X-axis size is 2miles / 5km. Could you please write back to us with the GPX file of this Route at support@hammerhead.io since we are unable to fetch your email address from our records. In this way, we will be able to analyze the route and give you an explanation of why the upcoming elevation is higher than the current elevation even though it is not matching with the elevation graph.
-
Thanks, this route is public on Strava: https://www.strava.com/routes/23306723. However, the value at the top not corresponding to the upcoming elevation has appeared to be the case on every route that I've used and throughout the whole ride - it doesn't seem to be route or position-specific, so I don't think that looking at a specific route will help. I only used that instant as my example because the inconsistency was much clearer then.
To better pinpoint the issue/problem, can you please state more specifically what you mean by this number representing 'upcoming elevation' because this is still very vague and doesn't answer my original question: Is it supposed to be the elevation at the end of the next km? Maybe at the far right-hand side of the graph (i.e., 4 kms away)? At some other distance away?
-
Continuing my quest to figure out this mystery data field, yesterday I noticed that there is a value in the same place on the Historic Elevation chart, and the value on that screen is definitely the current elevation because it corresponds perfectly to the value shown in the normal Current Elevation data field.
So, probably that is what the value on the Upcoming Elevation page is supposed to be showing - current elevation, which would make sense, but there must be a bug that only applies to this page. Maybe instead of averaging the elevation over the previous 20 meters, someone mis-typed and set it to average over the previous 2000 meters (or something similar), because that's what it appears to be showing.
Once again, having the elevation shown down to a precision of 0.1 meters on each of these 2 pages is pretty ludicrous. The measurement is not that precise, so the number after the decimal point is just noise and is a waste of screen-space. Please remove it, round the value to the nearest meter, and keep the interface as clean and tidy as possible. Thanks.
-
I can't believe that no-one from Karoo can at least tell me what this number is SUPPOSED to be displaying, apart from the vague and ambiguous "upcoming elevation" response (which I could read for myself from the top of the screen, but it obviously isn't the case). The person who programmed this page must have an idea of what the specific goal was here.
-
Excellent news - I've done my own tech support and found out the answer to my question: The number in the top-left of the Upcoming Elevation chart (in the red diamond in my initial post) is the CURRENT ELEVATION BASED ON GPS/GLONASS POSITIONING. In contrast, the value in the 'Curr. Elevation' data field is the elevation based on barometric pressure, which was calibrated using the GPS data at the start of the ride. If the initial calibration was off, then the two values will not be the same.
On more ride today, there was about 100 meters difference between the GPS-derived elevation and the barometer-based elevation because I turned the device on inside a hotel in an Alpine valley. Even so, they kept this difference very consistently throughout the day. The elevation profile of my ride was much simpler, with far fewer undulations, which allowed me to figure out exactly what this mystery value represents.
I agree with the designers of the Upcoming Elevation chart that it makes sense to show the GPS-derived elevation on that chart because that is more likely to be consistent with the values shown on the chart because the GPS-derived elevation has a higher degree of precision. In contrast, because the GPS-derived elevation is susceptible to error when the GPS fix isn't so good and the barometric-derived value is more reliable and stable, it also makes sense to use the barometric-derived elevation when computing total ascent and when displaying the Historic Elevation chart, where the value in the top-left is indeed the barometric-derived value.
So, the correct answer to my question was not what Hari Krishnan said, the value has nothing to do with upcoming elevation, it is just an alternative version of the current elevation.
Finally, can someone please add this information to the support page for the Upcoming Elevation chart (https://support.hammerhead.io/hc/en-us/articles/360030418353-Feature-Showcase-Upcoming-Elevation-Graph), because at the moment that page does not explain what the displayed value is and why it does not correspond to the current elevation shown in the regular data fields. Thank you.
BTW, I've edited my original post with all the answers so that people don't have to read 10 responses to find out the ending to this story.

Please sign in to leave a comment.
Comments
11 comments