AltGraph v.1.0.33 – A 3D Isometric Altimetry & Radar extension for Karoo

Hi everyone,
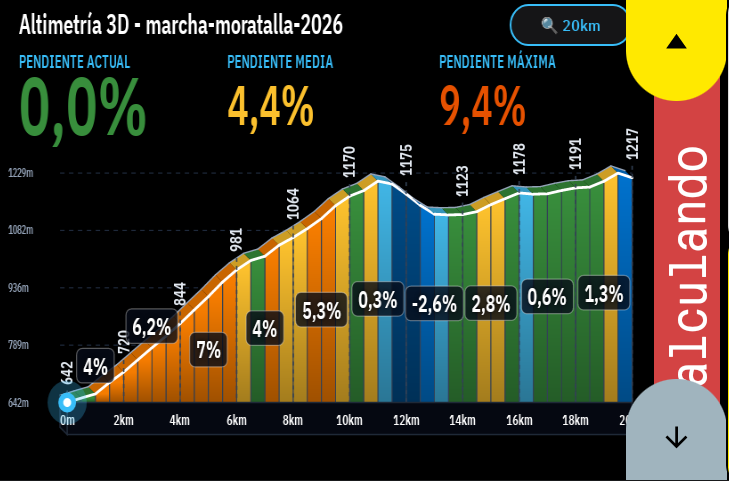
Sharing AltGraph, a highly visual climb and route overlay extension that completely reimagines how you see elevation on your Karoo.
Repo & releases: https://github.com/DAVOE75/ALTGRAPH
Why I built it: Two main frustrations with current elevation screens:
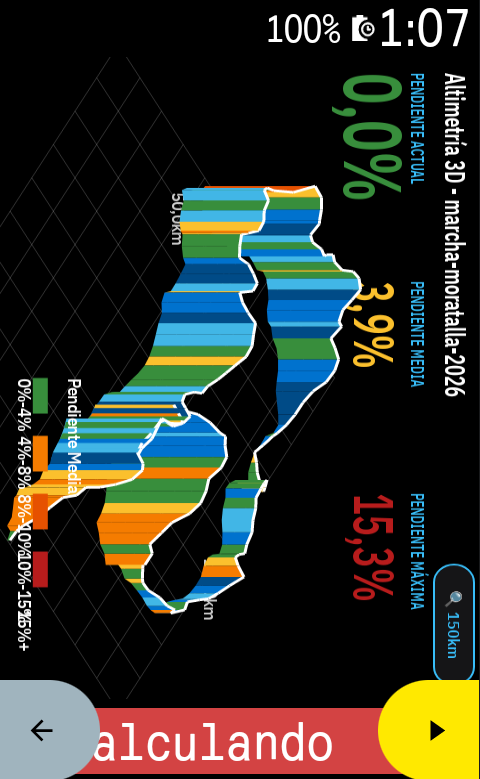
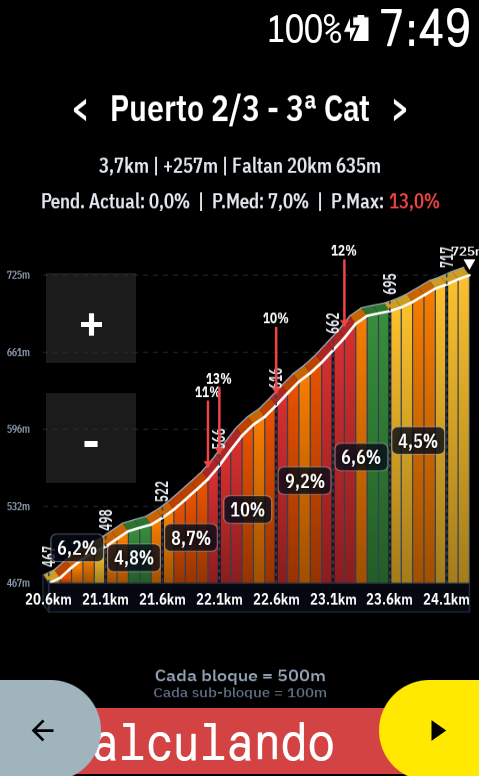
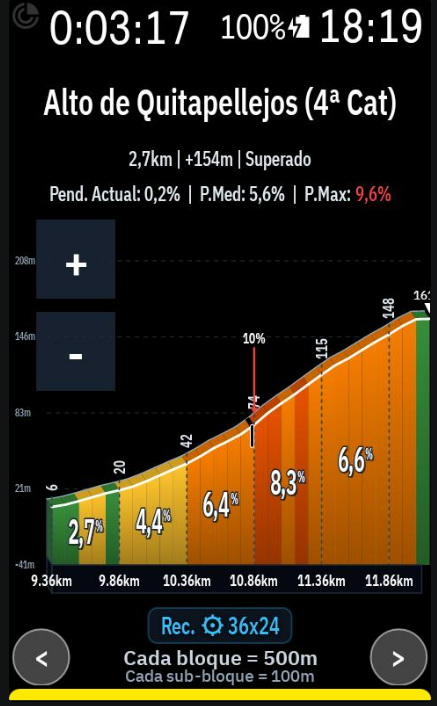
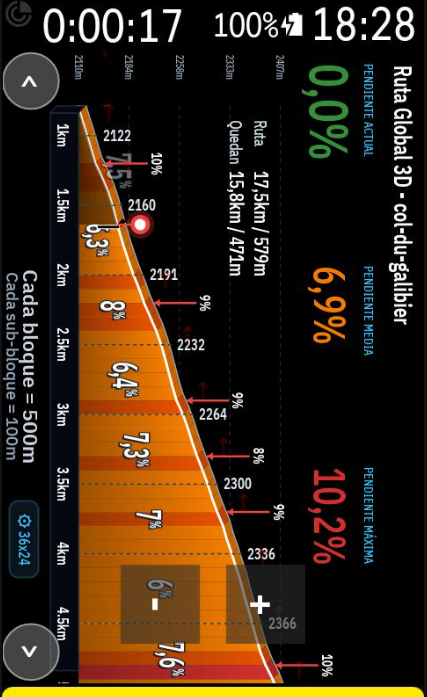
- Lack of spatial awareness and ugly 2D profiles: Traditional 2D flat profiles are okay, but they don't give you a real sense of the mountain. I wanted something spectacular. AltGraph introduces a beautiful 3D Isometric perspective that makes the upcoming climbs look and feel like real terrain.
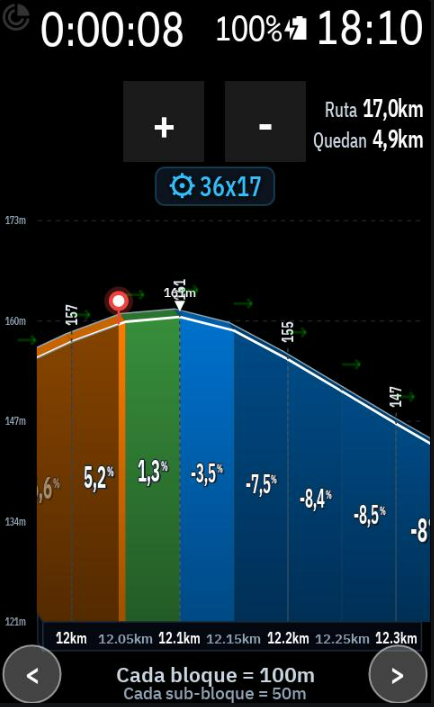
- You are forced to look at what you don't need: Sometimes you want to look ahead at the next ramp without zooming out the whole route. I built dedicated interactive touch buttons for fine zooming (down to 50m blocks!) and predictive horizontal panning (< / >), so you can freely slide the graph left or right to see what's coming, independently of your zoom scale.
What it does:
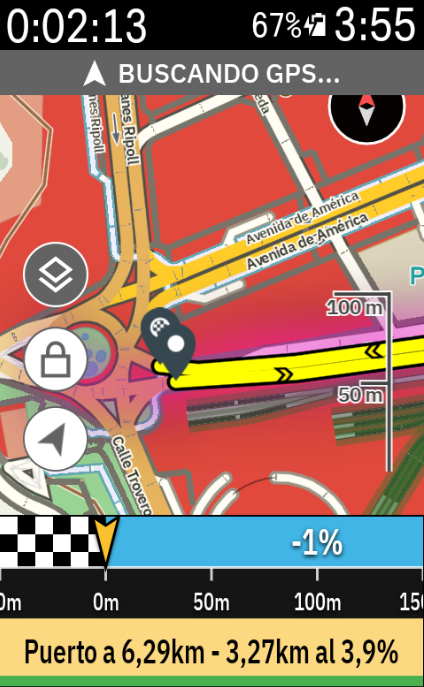
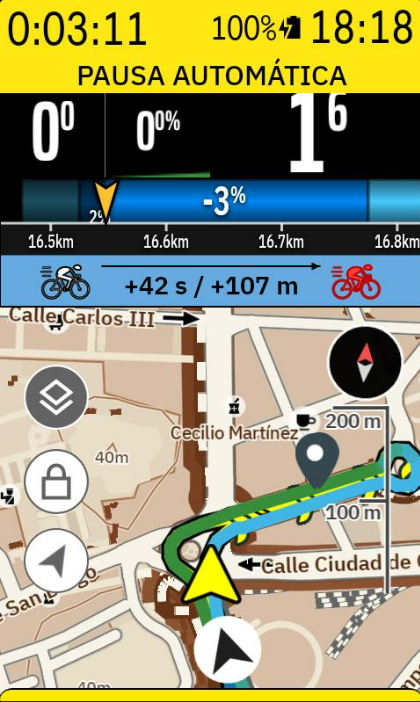
- Altimetry Radar Mode: A gorgeous view that overlays the 3D climbing relief directly over your navigation map. See your route and the elevation of what's ahead simultaneously on the same screen.
- Real-Time Cyclist Tracking: A live marker smoothly advances through the profile and gradient colors, giving you immediate feedback on where you are relative to the current ramp.
- Native Landscape Mode: Full support for horizontally mounted Karoos. Touch buttons and graphs automatically re-orient ergonomically to your visual field.
- Training Zones Bar: A dynamic 7-zone colored bar at the bottom of the screen that reacts to your live Power (Watts) or Heart Rate data while you climb.
- "Smart Zoom" Override: The app can auto-adjust the zoom based on your current gradient, but the moment you touch the [+] or [-] buttons, you take 100% manual control.
I would love it if you could install the v1.0.0 APK, take it for a ride, and give some feedback!
Hola a todos,
Os comparto AltGraph, una extensión super visual que reimagina por completo cómo vemos la altimetría y las subidas en nuestros Karoo.
Repo y descargas: https://github.com/DAVOE75/ALTGRAPH
Por qué la he creado: Principalmente por dos frustraciones con las pantallas de perfil actuales:
- Falta de perspectiva y perfiles 2D aburridos: Los perfiles planos tradicionales cumplen su función, pero no te dan una sensación real de la montaña. Quería algo espectacular. AltGraph introduce una perspectiva Isométrica 3D preciosa que hace que el relieve cobre vida.
- Te obligan a ver lo que no necesitas: A veces quieres ver cómo de dura es la siguiente rampa sin tener que alejar el zoom de toda la ruta. He añadido botones táctiles dedicados para tener un zoom súper preciso (¡hasta bloques de 50 metros!) y desplazamiento horizontal (< / >) predictivo. Puedes arrastrar la gráfica libremente a izquierda y derecha para ver qué te espera más adelante sin alterar la escala.
Qué hace exactamente:
- Modo Radar Altimétrico: Una vista brutal que superpone el relieve 3D directamente sobre el mapa de navegación. Puedes ver por dónde vas en el mapa y la altimetría que te viene encima en una sola pantalla.
- Ciclista en Tiempo Real: Tu posición avanza fluidamente sobre el perfil gráfico y sus colores de pendiente, para que sepas visualmente en qué punto de la rampa estás sufriendo.
- Modo Apaisado (Landscape) Nativo: Si llevas el Karoo en horizontal, la interfaz, los botones y la gráfica se re-orientan automáticamente para adaptarse de forma ergonómica a tu campo de visión.
- Barra de Zonas de Entrenamiento: Una barra dinámica de 7 colores en la parte inferior que reacciona en tiempo real a tus Vatios de potencia o Frecuencia Cardíaca.
- Control Manual Absoluto: La app tiene un "Zoom Inteligente" que se adapta a la pendiente, pero en el momento que tocas el [+] o el [-], tomas el 100% del control manual.
¡Me encantaría que probaseis el APK de la v1.0.0 en vuestras próximas salidas y me deis vuestro feedback!
-

I don't want to hijack your extension because it is already brilliant. So much great work done. Garmin or wahoo wouldn't even have anything remotely as good as this extension.
Now. In my opinion, the beacon should move 200m from the start and then remain fixed with the route move forward. Similar to the one in the Routegraph extension.
I got AI to gray out part of my original imagine to explain what I mean. Also I'd still make the beacon bigger and remove grade % from grayed out part as per in my second AI image.
What do you think?
-
Thank you so much for the kind words, and for the great suggestion (and the annotated image, it made it very clear!). I agree completely: it's much more natural this way.
Version 2.8.8 includes both changes:
- Fixed beacon: the beacon now moves from the start of the route up to about 20% of the screen width and then stays fixed there, while the elevation profile scrolls underneath it, similar to Routegraph. You always see the same amount of route ahead instead of the beacon crossing the screen and jumping to the next page. The already-ridden section stays dimmed on its left.
- Bigger beacon: the beacon and its halo are about 45% larger, with a taller mast, so it is much easier to spot at a glance. The existing small/medium/large size setting still works on top of that.
I used 20% of the width rather than a fixed 200 m so the beacon stays in the same place at every zoom level (at 1 km zoom it is exactly 200 m). If you'd like it closer to the left edge or somewhere else, let me know and I'll tweak it.
Please give it a try on a ride and tell me what you think. Feedback like yours is what makes the extension better.
-
Wow....so impressed! How can you implement these changes so quick!? Garmin would take years even to fix a bug in their stuff haha.
One thing I missed in my previous comment. Would it be possible to make the gear icon optional? I am not convinced it adds much value to some riders like myself. It was suggesting me 34x15 in a flat road hehe
I'll test the new version out in the road tomorrow but today it was working super smooth.I kept looking at it for almost two hours and 100% spot on!
-
Thank you, that's really kind of you to say! 🙏
Good call on the gear icon. I've made it optional in version 2.8.9: go to the 3D settings → Gearing card and you'll find a new switch, "Show recommended gear in 3D graph". Turn it off and the ⚙ badge disappears from the 3D profile and the climb viewer. It's on by default, so nothing changes for anyone who likes it.
You're right that a gear hint on a flat road isn't that useful, and 34x15 there doesn't make much sense. I'll take a look at how the recommendation is calculated so it makes more sense on flat and rolling terrain.
Let me know how the update and the fixed beacon work out on your next ride!
-
Morning!
Sorry now I am abusing here but I thought about giving you some feedback since I have had few rides now with the extension on. You may want to consider some of them, or none at all of course.1- When gear ratios are hidden, move the graph down and use the freed space for a bigger elevation profile.
2- Show the total route distance and the distance remaining somewhere on the graph. See my imagine attached as an example.
3- The percentages and colours appear to recalculate as you move along the graph. It might be better if they stayed fixed once set.
4- Another idea is to merge neighbouring blocks of a similar colour into one. For example, three green blocks in a row could show as a single green block covering the combined distance. It could help to remove the 150 m sub-blocks, or merge them, to reduce the clutter.In the screenshot, the 0.5% and 2.4% sections are both dark green but shown as separate sub-blocks. This is a good example of where merging would help.
5- Option to show grade percentages (%) within a range. Let's say in my case I am not interested in anything between -2% and 2%. Again this may help reduce clutter in the graph and make it more clean and readable.
Hope you do not mind me writing so much here. Have a nice week!
Ignore anything in the image a part from the router totals
-
Hi, thanks for the detailed feedback. Here is what's changing in v2.9.0, and the answer to your question.
Beacon behaviour (new setting)
In Settings → 3D you can now choose between two modes:- Fixed beacon (default): the beacon stays at 20% and the graph scrolls.
- Moving beacon: the beacon moves along the graph and the page jumps when it reaches the end.
Your suggestions
- Bigger profile when gear ratios are hidden: the graph now moves down and uses the freed space for a taller elevation profile. This is automatic.
- Route distance: total and remaining distance ("Route 100km / Left 65km") now appear at the top right of the graph, as in your screenshot. There is a switch to turn it off.
- Fixed percentages and colours: you were right. The blocks were recalculated from your position, so their values changed as you rode. They are now anchored to the route and no longer change as you move.
- Merge similar blocks (optional, off by default): neighbouring blocks of the same colour are drawn as one block with a single average percentage, so your 0.5% and 2.4% green sections become one.
- Hide percentages within a range (optional, off by default): set a range (for example -2% to 2%). Gradients inside it keep their colour but their percentage label is hidden.
Both options are under the "Cleaner profile" card in the 3D tab.
Your separate question: the two map options
- Map Gradient Overlay Mode: colours the route line on the Karoo map by gradient. You can choose Off, Only Climbs or Entire Route.
- Smooth Route Coloring on Base Map: blends the colour between neighbouring segments instead of changing abruptly. The blend is short, at most about 60 m, so it is subtle at normal zoom.
Both are Elite features. They only affect the Karoo map, not the ALTGRAPH graphs. They only show with Elite unlocked and an active route that has elevation data.
You may not have seen any difference because of a bug on our side. After you changed either option, the map was not redrawn until the route was reloaded. This is fixed in v2.9.0, so changes now apply on the next navigation update.
Please let us know if you still see no difference after updating.
-
Thanks for much the changes in the new update. I honestly think these are great features and that you've been able to implement them so quick is absolutely remarkable.
Quick question in point 4. Now in new merged blocks, does it auto-calculate the new average grade for the merged block? The logic works merging by blocks of same colour, right? Or blocks within a % margin difference? Like blocks within 1%. Just curious.
I'll test it tomorrow on the road and get back to you. Two hours ride.
-
Thank you so much for the kind words, and for the great suggestions. They made the app better. v2.9.1 is out with everything below.
Answer to your question about merged blocks
- Average grade: yes, a merged block shows the new average gradient of all the blocks it contains. Since the blocks have equal length, it is the true average over the merged distance.
-
What decides the merge: it merges neighbouring blocks that fall in the same colour band, not blocks within a fixed % margin. The bands are the ones used for the colours:
- below -10%
- -10 to -5%
- -5 to -2%
- -2 to 0%
- 0 to 3%
- 3 to 5%
- 5 to 8%
- 8 to 10%
- 10 to 13%
- 13 to 17%
- above 17%
- Your example: that is why your 0.5% and 2.4% sections merge: both are in the 0–3% green band. A 2.9% and a 3.1% block would not merge, because the colour changes at 3%.
- A margin option: a "merge blocks within X%" option is possible. Tell me if you would like it.
What's new
- Beacon behaviour: choose a fixed beacon (graph scrolls) or a moving beacon with page jumps. Blocks are anchored to the route, so percentages and colours no longer change as you ride.
- Route distance: total and remaining distance on the graph.
- Taller profile: when the recommended gear is hidden, the profile moves down and becomes taller.
- Merge blocks (Off / Auto / Always): Auto merges only when you are zoomed out, so labels stay large and clean. Always merges at every zoom.
- Hide percentages in a range: for example -2 to 2. Gradients in the range keep their colour but their label is hidden.
-
Labels:
- The gradient label now stays on top of the shading.
- It grows when you zoom in.
- The ruler shows sub-block distances at high zoom.
- "Clean" gradient label (optional): a tall white number with no box, a thin outline and shadow, and a small % like a degree symbol. It applies to the Global 3D graph and the climb viewer.
- Hairpins: now have a small vertical line on the graph.
- Map gradient overlay: now redraws as soon as you change the setting. That may be why you saw no difference before.
Have a great two-hour ride tomorrow! I'd love to hear how it goes.
-
If easy enough to implement and you do not mind this would be great. The more options the better. It may work out better for blocks which fall in opposite extremes. For instance, 2.9% and 3.1% would merge being within a 1% difference.
A margin option: a "merge blocks within X%" option is possible. Tell me if you would like it.
-
Hi, and thank you for the suggestion and for the clear example. The "merge within a margin" idea is now in v2.9.2.
Merge blocks within a margin
- Where: Settings → 3D → "Cleaner profile" → "Merge blocks within a margin (%)".
- How it works: neighbouring blocks whose gradient differs by less than the margin you set are merged, even if their colours differ. With 1, your 2.9% and 3.1% blocks merge.
- Result: the merged block shows the average gradient and takes the colour of that average.
- Default: 0, which means off. It only applies when you set a number above 0.
- Compatibility: it works at any zoom level, and it combines with the Off / Auto / Always colour merge and with the hide-a-range option.
Also new in 2.9.2
- Recommended gear: it now uses the real gradient just ahead of you, so the suggestion changes at the right moment and doesn't lag behind the blocks.
- Gradient labels: labels of blocks you have already passed now dim with the graph. The one for your current block stays visible.
- No-header layout: if you hide the title and gradient data, the gear badge moves under the zoom buttons and the graph moves down and gets taller.
- Route / Left: larger, placed below the top elevation line, and uses your chosen font.
Please let us know how it feels on the road. Enjoy your ride!
-
Brilliant. Looking forward to testing all new features.
I guess your next big challenge could be, how to handle re-routing in a loaded route. I mean when Karoo calculates a re-routing once a rider is off the route, how Altgraph 3d route map could handle it. I know this is a tough one due to Hammerhead constraints.
-
Is there sufficient space to accommodate elevation in the route total and left?
Example:
Route 18,9km / 700m
Left 5,6km / 67m -
Hi,
Thank you again for your feedback and ideas. v2.9.4 is out and includes a lot from your suggestions.
What's new
- Gear by effort: the recommended gear now targets a good cadence for each terrain: climbs 70-85 rpm, flat 85-95 rpm and descents 90-100 rpm. The speed is estimated from your FTP, weight and heart rate (a high heart rate eases the gear, a low one allows a harder gear). Set your FTP, weight and max heart rate in Settings → 3D → Drivetrain. With no heart rate sensor, FTP and weight alone are used.
-
Elevation gain in Route / Left: the total and the remaining climbing now appear next to the distances, for example
18.9km / 700mand5.6km / 67m. You can place them on the left or on the right in the settings. - Merge blocks within a margin: neighbouring blocks whose gradient differs by less than a margin you set are merged, even if their colour differs. The default is 0, which means off.
- Gradient labels that always fit: the percentage of each block now shrinks or moves so it stays inside the profile.
- Ridden section: labels of blocks you have already passed dim with the graph, and the one you are in stays visible.
- Layout without header: the gear badge moves under the zoom buttons, also in landscape, and the graph moves down and gets taller.
- Route / Left text: larger, placed below the top elevation line and using the font you chose in Style.
-
Your update came in when I was almost half way onto my ride so I could see the changes and how they played out.
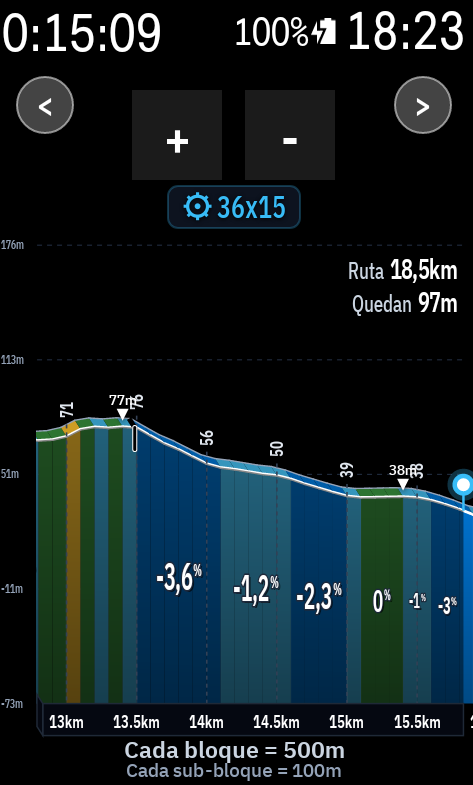
I am afraid I got the elevation suggestion all wrong. Not enough space and then gets overlapped by the zoom buttons (see imagine below)
I guess I'd drop the elevation stats idea, or make the elevation stats optional, and push the route and left distances a bit higher up in the same row that the zoom buttons so they don't overlap the climb elevation graph (see image below).
What do you think?Apart from that, the rest is so good! Brilliant! Absolutely brilliant! See imagine and how well it displays and compares with the HH climb detection climb.
https://ibb.co/sMPY2HZ
https://ibb.co/rK74JcMZ
https://ibb.co/sdZ3Z2TS
https://ibb.co/G4DRtBw9
https://ibb.co/N2DQZPwF -
Hi, thank you, and I'm really glad it works well on the road.
Please update to ALTGRAPH v2.9.5, which includes these changes.
Route / Left and elevation
- Elevation is now optional: it's off by default, so you'll only see the distances. You can switch it on in Settings → 3D, under "Show total and remaining route distance".
- Position: the Route / Left data moves up into the same row as the zoom buttons, so it stays clear of the climb profile. The text shrinks if it needs to.
- Left or right: you can put the data on whichever side you prefer, in the same settings card: Right or Left.
Also in this update
- Ruler: it now shows an extra decimal where needed, for example 9.95km.
- Map: when a road is ridden twice, such as out and back, the two passes are drawn side by side, each in its own colour.
Hammerhead climber
Now that ALTGRAPH detects the climbs and shows the profile, you no longer need the built-in Hammerhead climber. You can turn it off in the profile options.Thanks again and enjoy AltGraph For Karoo!
-
Hi again,
The zoom button fix is out in v2.9.6, so please update when you can.
- Zoom buttons: they now move to the top whenever "Show data in header" is off, even if "Show max gradient" is still on.
- Also included from v2.9.5 (if you haven't updated yet): the elevation figures next to Route / Left are optional and off by default, the data sits in the same row as the zoom buttons, and you can place it on the left or the right in the settings.
Let me know how it goes. Thanks again for the feedback!
-
Sorted now! :-)
-
Sorry to be a pain......could you explain to me a bit deeper how this one works? If I am in the 3d grahp, which it is really the only one which I have been using, do I get a prompt for the climb or just simply see it in the graph itself?
I'd love to switch off the HH climb detection one as it is not great imo.
Hammerhead climber
Now that ALTGRAPH detects the climbs and shows the profile, you no longer need the built-in Hammerhead climber. You can turn it off in the profile options. -
Not a pain at all, good question.
In the 3D graph itself there is no popup or prompt when a climb starts. You simply see the climb in the profile: the orange and red blocks are the climb, each block shows its gradient, steep ramps get an arrow with the percentage, and hairpins are marked. The summits are flagged with a small triangle and their altitude.
Where the climb details are: the name, category, length, elevation gain and average and max gradient are in the Climb Viewer, a separate data field that you add to a ride page. You can also turn on the voice alerts in the Elite settings: ALTGRAPH announces the start of a climb (name, length, average gradient and category) and the summit 500 m before.
How the climbs are found: from the elevation profile of your route. A climb starts when the next 200 m average at least 2.5%, and it has to be at least 500 m long with 25 m of climbing. If you have placed Start and Summit points of interest on your route, those define the climbs instead.
About switching off the Hammerhead climber: I should be clear that ALTGRAPH does not automatically switch pages or show a prompt like the Hammerhead climber does. If you turn it off, you lose that automatic alert and page, and you rely on the graph, the Climb Viewer and the voice alerts. I run with it off and it works fine, but it depends on how you like to ride. If you want the automatic prompt, keep it on. If you prefer a clean 3D graph, it's safe to turn it off.
-
Hi,
Thanks for the follow-up and for your patience.
You're right to ask, and I should be more precise than in my last message. In the 3D graph you see the climb directly in the profile: the orange and red blocks, the gradient on each block, the steep ramp arrows and the summit markers. There is no popup or automatic page change, which is what the Hammerhead climber gives you.
The good news is that I've just added an optional climb alert that works on any ride page. When a climb is about to start, about 400 m before, a short banner shows its name, length, average gradient, category and elevation gain. I've tested it on a ride and it works. It will come in the next update, and I'll let you know when it's out, so you can then switch off the Hammerhead climber with no loss.
Until then, if you prefer to keep the Hammerhead climber on, that's the safest option. Switching it off now means you won't get an automatic alert for climbs.
Thanks again for all the feedback.
-
Thanks, and sorry for not answering it properly before. I've looked into it.
When you go off route, Karoo sends ALTGRAPH the route you were following, plus the path back to it and the distance along the route where that path rejoins. It does not send elevation data for that path back, so ALTGRAPH can't draw the real profile of the detour.
Right now ALTGRAPH ignores that information. When you leave the route, the beacon stays near the closest point of the original route and the profile keeps showing the original route, and nothing tells you that you are off it.
What I'm planning:
- Off-route state: a clear "off route" indication on the graph, with the beacon held at the last point on the route.
- Rejoin marker: a flag on the profile where Karoo rejoins the route, with the distance left to get there.
- Detour elevation: I'll show it as a dotted estimate between your current altitude and the rejoin point, or leave it out, because there is no real data.
Before building it I want to test it with a simulated off-route ride, to see exactly what Karoo sends. I'll let you know how it goes.
-
Out of curiosity. Which data fields are these?
-
Version 2.9.7 is now available to update in your karoo.
The fields you see at the top of the graph correspond to fields generated by the BigNum extension.
The BigNum slope field came without the percentage icon, so I updated it in my karoo to include the percent sign for better readability. Everything else remains the same. I recommend it because it takes up less space and the numbers are larger.
-
Some food for thoughts for you.
Whenever you implement the climb alert, it would be great if the banner keeps popping up every X% of the climb distance with length, average gradient, and elevation remaining. You could make it optional in case some people may not want it at all. I wrote X% of the climb but this could also be based on evey X min or any other metric. In my head, X% of the climb sounds more logical when riding, like 25%,50%,75% and 10% of the climb distance. My understanding is that this banner would clear by itself without rider's action, not need to swipe it away, right?
Looking forward to it.
-
Some more feedback from today's ride.
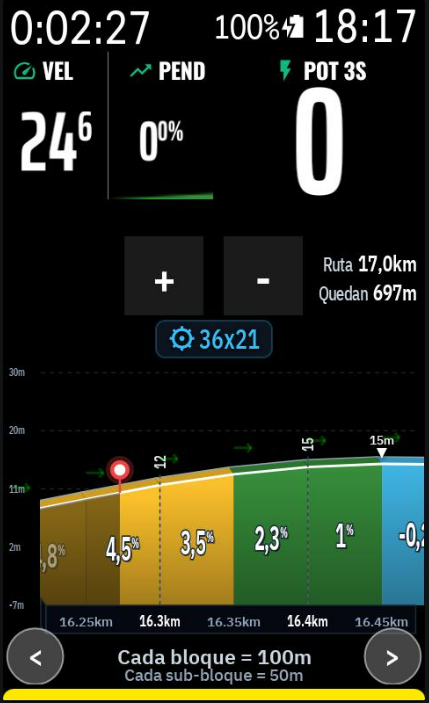
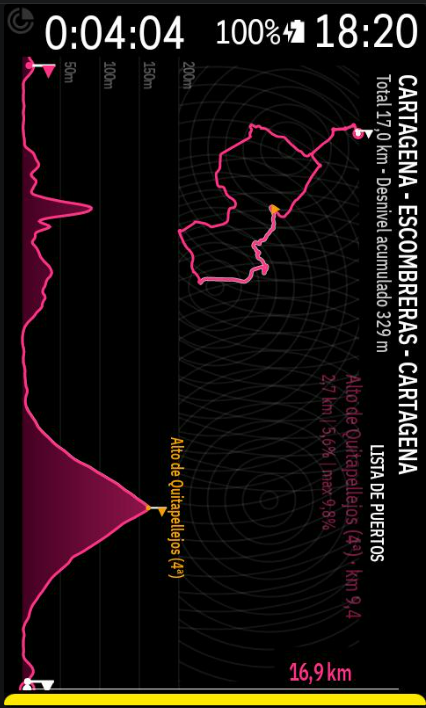
I had the 2D graph map. Generally anyone using it, will be in a vertical way I'd imagine. Therefore, these are my suggestions:
1- Cut down the white vertical line.
2- Remaining distance line should be white as faint grey is very hard to see in the sun.
3- When remaining left km number runs out of space, push it to the left of the vertical line.4- Also list elevation underneath kms complete and left5- Climb list..it is very hard to read at the moment. It should be white (or some other colour) and should say complete when completed (ideally)
Before:
https://ibb.co/DDQwRfTn
After:
https://ibb.co/39XjVC4C
https://ibb.co/1CXDSgk
Please sign in to leave a comment.
Comments
101 comments