AltGraph v.1.0.33 – A 3D Isometric Altimetry & Radar extension for Karoo


Hi everyone,
Sharing AltGraph, a highly visual climb and route overlay extension that completely reimagines how you see elevation on your Karoo.
Repo & releases: https://github.com/DAVOE75/ALTGRAPH
Why I built it: Two main frustrations with current elevation screens:
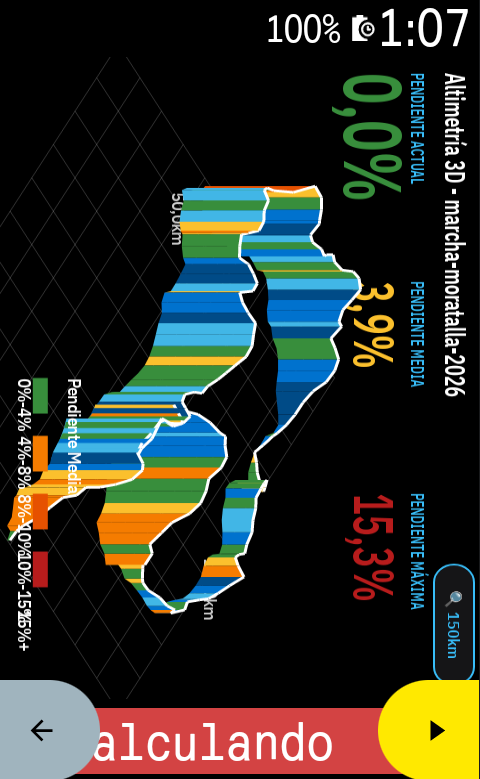
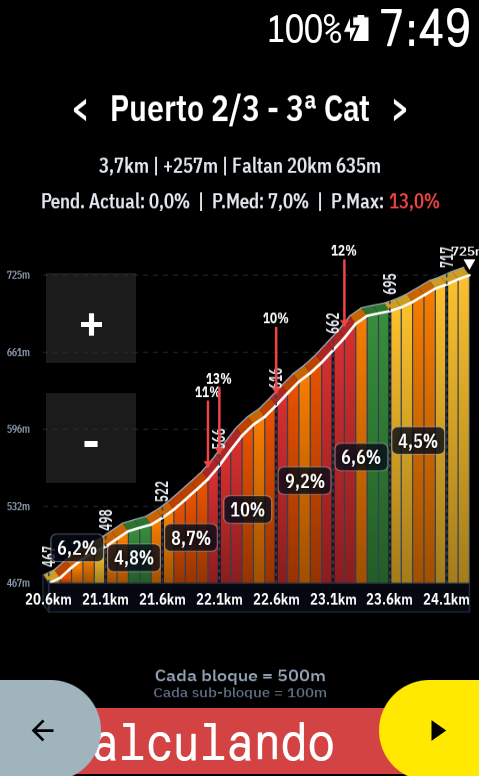
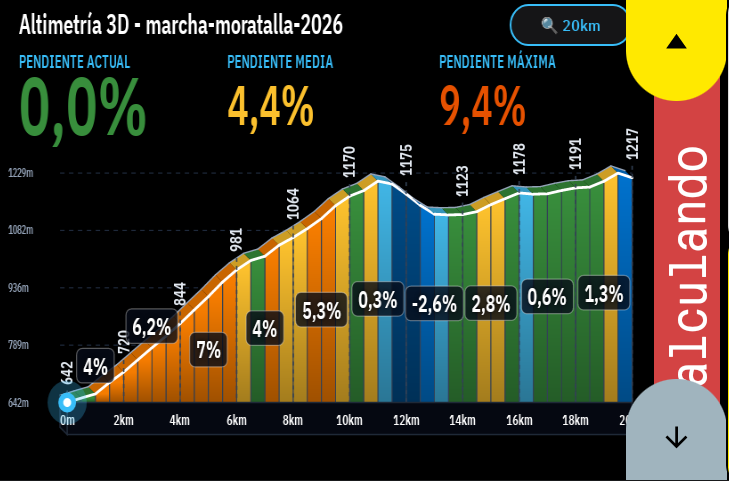
- Lack of spatial awareness and ugly 2D profiles: Traditional 2D flat profiles are okay, but they don't give you a real sense of the mountain. I wanted something spectacular. AltGraph introduces a beautiful 3D Isometric perspective that makes the upcoming climbs look and feel like real terrain.
- You are forced to look at what you don't need: Sometimes you want to look ahead at the next ramp without zooming out the whole route. I built dedicated interactive touch buttons for fine zooming (down to 50m blocks!) and predictive horizontal panning (< / >), so you can freely slide the graph left or right to see what's coming, independently of your zoom scale.
What it does:
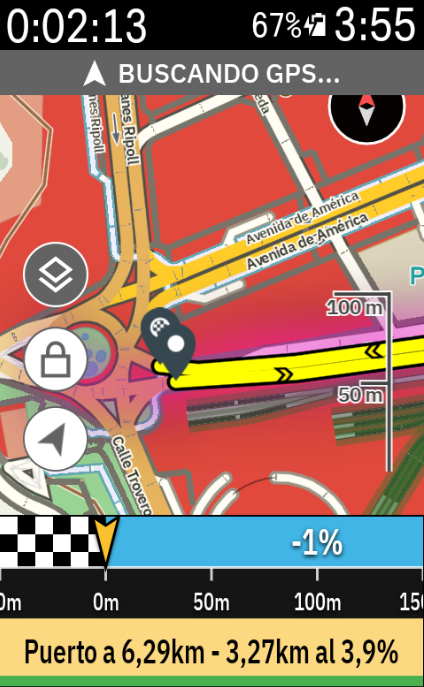
- Altimetry Radar Mode: A gorgeous view that overlays the 3D climbing relief directly over your navigation map. See your route and the elevation of what's ahead simultaneously on the same screen.
- Real-Time Cyclist Tracking: A live marker smoothly advances through the profile and gradient colors, giving you immediate feedback on where you are relative to the current ramp.
- Native Landscape Mode: Full support for horizontally mounted Karoos. Touch buttons and graphs automatically re-orient ergonomically to your visual field.
- Training Zones Bar: A dynamic 7-zone colored bar at the bottom of the screen that reacts to your live Power (Watts) or Heart Rate data while you climb.
- "Smart Zoom" Override: The app can auto-adjust the zoom based on your current gradient, but the moment you touch the [+] or [-] buttons, you take 100% manual control.
I would love it if you could install the v1.0.0 APK, take it for a ride, and give some feedback!
Hola a todos,
Os comparto AltGraph, una extensión super visual que reimagina por completo cómo vemos la altimetría y las subidas en nuestros Karoo.
Repo y descargas: https://github.com/DAVOE75/ALTGRAPH
Por qué la he creado: Principalmente por dos frustraciones con las pantallas de perfil actuales:
- Falta de perspectiva y perfiles 2D aburridos: Los perfiles planos tradicionales cumplen su función, pero no te dan una sensación real de la montaña. Quería algo espectacular. AltGraph introduce una perspectiva Isométrica 3D preciosa que hace que el relieve cobre vida.
- Te obligan a ver lo que no necesitas: A veces quieres ver cómo de dura es la siguiente rampa sin tener que alejar el zoom de toda la ruta. He añadido botones táctiles dedicados para tener un zoom súper preciso (¡hasta bloques de 50 metros!) y desplazamiento horizontal (< / >) predictivo. Puedes arrastrar la gráfica libremente a izquierda y derecha para ver qué te espera más adelante sin alterar la escala.
Qué hace exactamente:
- Modo Radar Altimétrico: Una vista brutal que superpone el relieve 3D directamente sobre el mapa de navegación. Puedes ver por dónde vas en el mapa y la altimetría que te viene encima en una sola pantalla.
- Ciclista en Tiempo Real: Tu posición avanza fluidamente sobre el perfil gráfico y sus colores de pendiente, para que sepas visualmente en qué punto de la rampa estás sufriendo.
- Modo Apaisado (Landscape) Nativo: Si llevas el Karoo en horizontal, la interfaz, los botones y la gráfica se re-orientan automáticamente para adaptarse de forma ergonómica a tu campo de visión.
- Barra de Zonas de Entrenamiento: Una barra dinámica de 7 colores en la parte inferior que reacciona en tiempo real a tus Vatios de potencia o Frecuencia Cardíaca.
- Control Manual Absoluto: La app tiene un "Zoom Inteligente" que se adapta a la pendiente, pero en el momento que tocas el [+] o el [-], tomas el 100% del control manual.
¡Me encantaría que probaseis el APK de la v1.0.0 en vuestras próximas salidas y me deis vuestro feedback!
-
Hi David,
Thanks a lot for the photo and the spot-on feedback from your ride! Real-world feedback under direct sunlight is priceless.
I have addressed all your points in the new v2.9.8 release, specifically tailored for the vertical 2D stage profile:
- Cut-down vertical line: The white cyclist line no longer shoots all the way up across the entire screen or over the minimap; it is now bounded to the elevation profile height for a much cleaner view.
-
White remaining profile line: Replaced the faint grey with a high-contrast white (
#E0E0E0) line so the upcoming profile silhouette is crisp and clearly visible even with polarized sunglasses under bright sun. - Smart margin positioning for remaining km: When approaching the end of the route and running low on right-edge space, the remaining distance automatically shifts to the left side of the vertical indicator so numbers never get cropped.
-
Elevation gain included: Added completed elevation gain (
+Xm) under completed km, and remaining elevation (-Ym) under remaining km. -
High-contrast Climb List & Completed status: Made upcoming climbs crisp white with vivid amber category markers. Once you summit a pass, it automatically updates to a distinct green
✓ Donebadge.
Regarding your thoughts on the Climb Alert progress banners (every 25%, 50%, 75%...): I completely agree with your logic! Progress percentage is much more meaningful than time while climbing, and making it self-dismissing without touching the screen is essential for safety. I am designing that flow next!
You can download the new v2.9.8 update directly on GitHub / Sidequest. Let me know how it feels on your next ride!
-

Thanks for those changes in the 2D Stage Profile. Much appreciated. I'll test it tomorrow on my morning spin.
Two quick things though.
1- Would it not be more logical to have the km and elevation stats horritally and match the horizontal profile elevation stage? I found them very hard to see vertically.
2- I'd personally apply the smart margin position at both ends. Begining and end of the profile stage, specially if they go horizontally in the horizontal view. -
I hope you do not get sick of my feedback because I keep giving you loads!
I have been using the 3D profile elevation in every ride for almost a week now and I have always had the feeling that the scaling could do a bit better so I got "playing" with Claude and testing few different options. Eventually and after few prompts and interactions with Claude, this is what I got. I am attaching some images so you can see my point.
-
A suggestion for the elevation profile chart.
The problem
The y-axis uses a fixed 249m span at every zoom level (for example -15m to 234m, -52m to 197m). The route only uses part of it, so at short zoom levels the profile is squashed into a thin strip: about 7m of variation at 2.2km uses roughly 3% of the chart height, and about 15m at 5km uses roughly 6%. The terrain shape is nearly invisible.
The proposal
Fit the axis to the elevation in the visible window, with a minimum span that grows with the window length:
buckets = mean elevation per bucket (window_m / chart_w_px)
range = max(buckets) - min(buckets)
minSpan = clamp(chart_h_px * window_m / (chart_w_px * 55), 30, 100)
span = max(range * 1.2, minSpan), rounded up to 5m
mid = (min + max) / 2
axisMin = floor((mid - span / 2) / 5) * 5
axisMax = axisMin + spanPeak markers should use the true raw maximum. Show three y labels only, stop the fill at axisMin, and add a small span tag (for example "50m span").
Example: at 5km with data from 114m to 129m, the axis becomes 95m to 145m and the profile fills the middle of the chart. At 71km it fits the data range instead, so the profile uses about 80% of the height instead of 40%.
-
Why it's clearer and realistic
- The profile uses the chart height, so climbs and descents are visible at every zoom.
- The 30m minimum stops flat roads looking like mountains.
- Scaling the minimum with the window keeps steepness consistent across zooms from about 3km to 10km.
- Smoothing by distance removes the spikes on the 71km view.
- Gradient labels and colour bands are unchanged. -
Trade-off: the 71km overview will look steeper than the road is, because the data range decides the axis. I'd accept that, since the gradient labels carry the real steepness.
While riding, recalculate only when the profile leaves the middle 80% of the axis (or every 100m), and ease the change over about 300ms to avoid jitter. The values 55 and 30 to 100m are untested starting points, so it would be worth logging the axis on a flat, rolling and hilly route.
-
Screenshots at 2.2km, 5km and 71km available if useful.
-
Thanks David, this is great feedback, and please keep it coming!
Your suggestion is now in AltGraph v2.9.18 as a new option: vertical scale fitted to the visible stretch (3D profile settings).
What it does:
- The y-axis fits the elevation in the visible window instead of using a fixed span, so the terrain shape is visible at short zoom levels.
- Gradient labels and colour bands are unchanged.
Why it's optional (off by default): at some zoom levels, fitting the scale exaggerates the relief a lot. For example, a gentle 1.5% slope can look like a mountain pass. The fixed scale is more faithful to the real steepness, so I didn't want to change it for everyone. You can switch it on whenever you want to see the terrain shape more clearly.
Please try it on a flat, a rolling and a hilly route and tell me how the scale feels. The constants (55 and the 30–100 m minimum span) are starting points that I can tune from your feedback.
Thanks for the ideas and the screenshots!
-
Thanks David, glad the new scale looks better! Rolling Irish terrain will be a great test, so let me know how it behaves there.
Good catch on the 2D Profile Stage. The negative sign on the remaining stats is confusing, so I'll remove it in the next release.
Thanks again for the feedback!
-
Thanks for taking on all my feedback. It is much appreciated.
In regards to the below change made in the last version, would you mind tweaking it a bit?
- The y-axis fits the elevation in the visible window instead of using a fixed span, so the terrain shape is visible at short zoom levels.
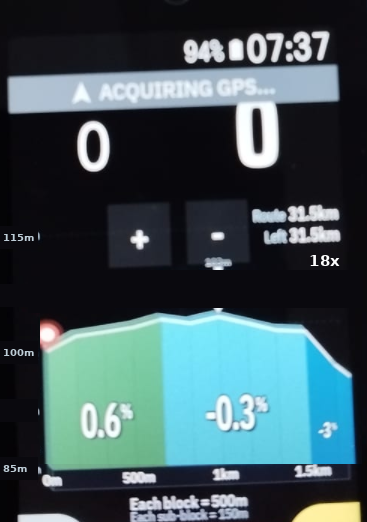
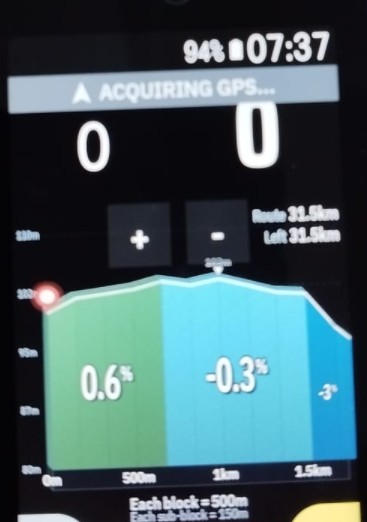
I found one more problem. The zoom buttons cover the top of the chart, and the highest point of the route sits right under them. I have changed the formula to leave headroom. It needs to work for every kind of terrain, from flat roads to mountains, so please test it on all of them. Here is the version I would like.
Settings, all easy to change
headroom = 0.7
vertical factor = 55
floor, set by the route type (see change 5)Formula:
rawMin and rawMax = min and max of the elevation in the visible window, after a median filter (see change 2)
range = rawMax minus rawMin
minSpan = chartH times windowM divided by (chartW times vertical factor), kept between floor and 100
span = max(range divided by headroom, minSpan), rounded up to the next 5m
axisMin = ceil((rawMax minus headroom times span) divided by 5) times 5
if rawMin is below axisMin, subtract 5 from axisMin until it fits
axisMax = axisMin + spanChanges from the original proposal
1. Use raw min and max for the range, not bucket means. The line can still be drawn from buckets, but the axis must come from raw values. This way the peak marker can never sit above the chart.
2. Clean the elevation first. One bad GPS or barometer reading, such as a tunnel or a bridge, stretches the range and flattens everything else. Take the min and max after a 3 point median filter. Keep the peak marker on the true highest value.
3. Headroom. The axis is placed so the highest point lands at 70 percent of the chart height or lower. From my photos the zoom buttons cover about the top 15 percent of the chart, so this leaves a safe gap. Dividing the range by the headroom value is what keeps this true on routes with a big elevation range. A fixed padding such as 1.2 pushes the peak to 80 percent or more on hilly routes. Example, with a peak of 103m and a span of 30m, the axis runs from 85m to 115m. Please also consider moving the buttons off the chart, since that fixes the root problem.
4. Sea level rule. If rawMin is at or above 0, set axisMin to the larger of axisMin and 0, then set axisMax = axisMin + span. If rawMin is below 0, skip this. On routes very close to sea level this can push the peak above 70 percent. Please check that case.
5. The floor depends on the route. Use the total ascent of the route divided by its length in km.
under 8m per km, floor = 20
8 to 20m per km, floor = 30
over 20m per km, floor = 40These thresholds are my starting guesses. A nearly flat route needs a lower floor so a 3 to 5m kicker is still visible. At short zooms the floor sets the span, so it is the main setting to tune.
6. Hysteresis. Keep the current axis while the raw min and max stay inside it. Only recompute when the data leaves the axis, when the peak goes above 85 percent of the chart height, or when the new span differs from the current span by more than 20 percent. Without this the profile will rescale in steps while riding.
7. Labels. Show three y labels only, rounded to the nearest meter, so a span such as 125m does not produce a label like 892.5m. Stop the fill at axisMin.
Tag
Please show the vertical exaggeration instead of the span in meters. The three y labels already give the span.
exaggeration = chartH times windowM divided by (span times chartW)
Show it as a small label like 18x, directly under the Left distance text at the top right of the chart, so it does not compete with the gradient blocks. Always show it. The floor changes between routes, so this label is the only thing that tells the rider how stretched the picture is. Please confirm the real numbers on the actual screen.
Testing
Please test these cases and check that the peak stays at 70 percent of the chart height or lower, and the labels stay readable.
Nearly flat road, range of 2m to 6m, for example a 92km route with 3 to 6m rises
Rolling terrain, range of 10m to 30m
Steep descent or climb, range of 60m to 120m in a 2km window
Mountain route, range of 300m or more
A route near sea level and a route below sea level
A route with one bad elevation point, to check the median filterSuggested tag location but please choose different one if you have any other.
-
Thanks David, the refinements are in v2.9.22:
- Raw min/max for the range. The axis was already built from raw values, so the peak marker can't sit above the chart.
-
Fit check after rounding. If
axisMaxends up belowrawMax,axisMingoes up in 5 m steps until it fits. -
Sea level rule. If
rawMinis at or above 0, the axis never goes below 0. - Hysteresis. The axis stays while the data fits inside it, and is only recomputed when the data leaves it or the new span differs by more than 20 %.
- Easy to tune. The 55 factor, the 30 m minimum span, the 100 m maximum and the 20 % threshold are now named constants. I'll try 20 m for the floor next.
Tag: it now shows the vertical exaggeration (e.g.
14x) at the top right of the chart, so it doesn't clash with the gradient blocks or the bottom buttons.Real numbers on the Karoo so far:
5.2xon a gentle descent and14xon a 3 km climb. The first is below your 7x to 30x range, and the 30 m floor is what limits it there, so I'd like to test 20 m. I haven't tested a hilly route with 300 m or more of range yet, so I can't confirm label readability there. If you try it first, tell me what you see.Thanks again for the detailed feedback!
-
Cool! I will test it now in the next hour on the road with this route you see. :-)
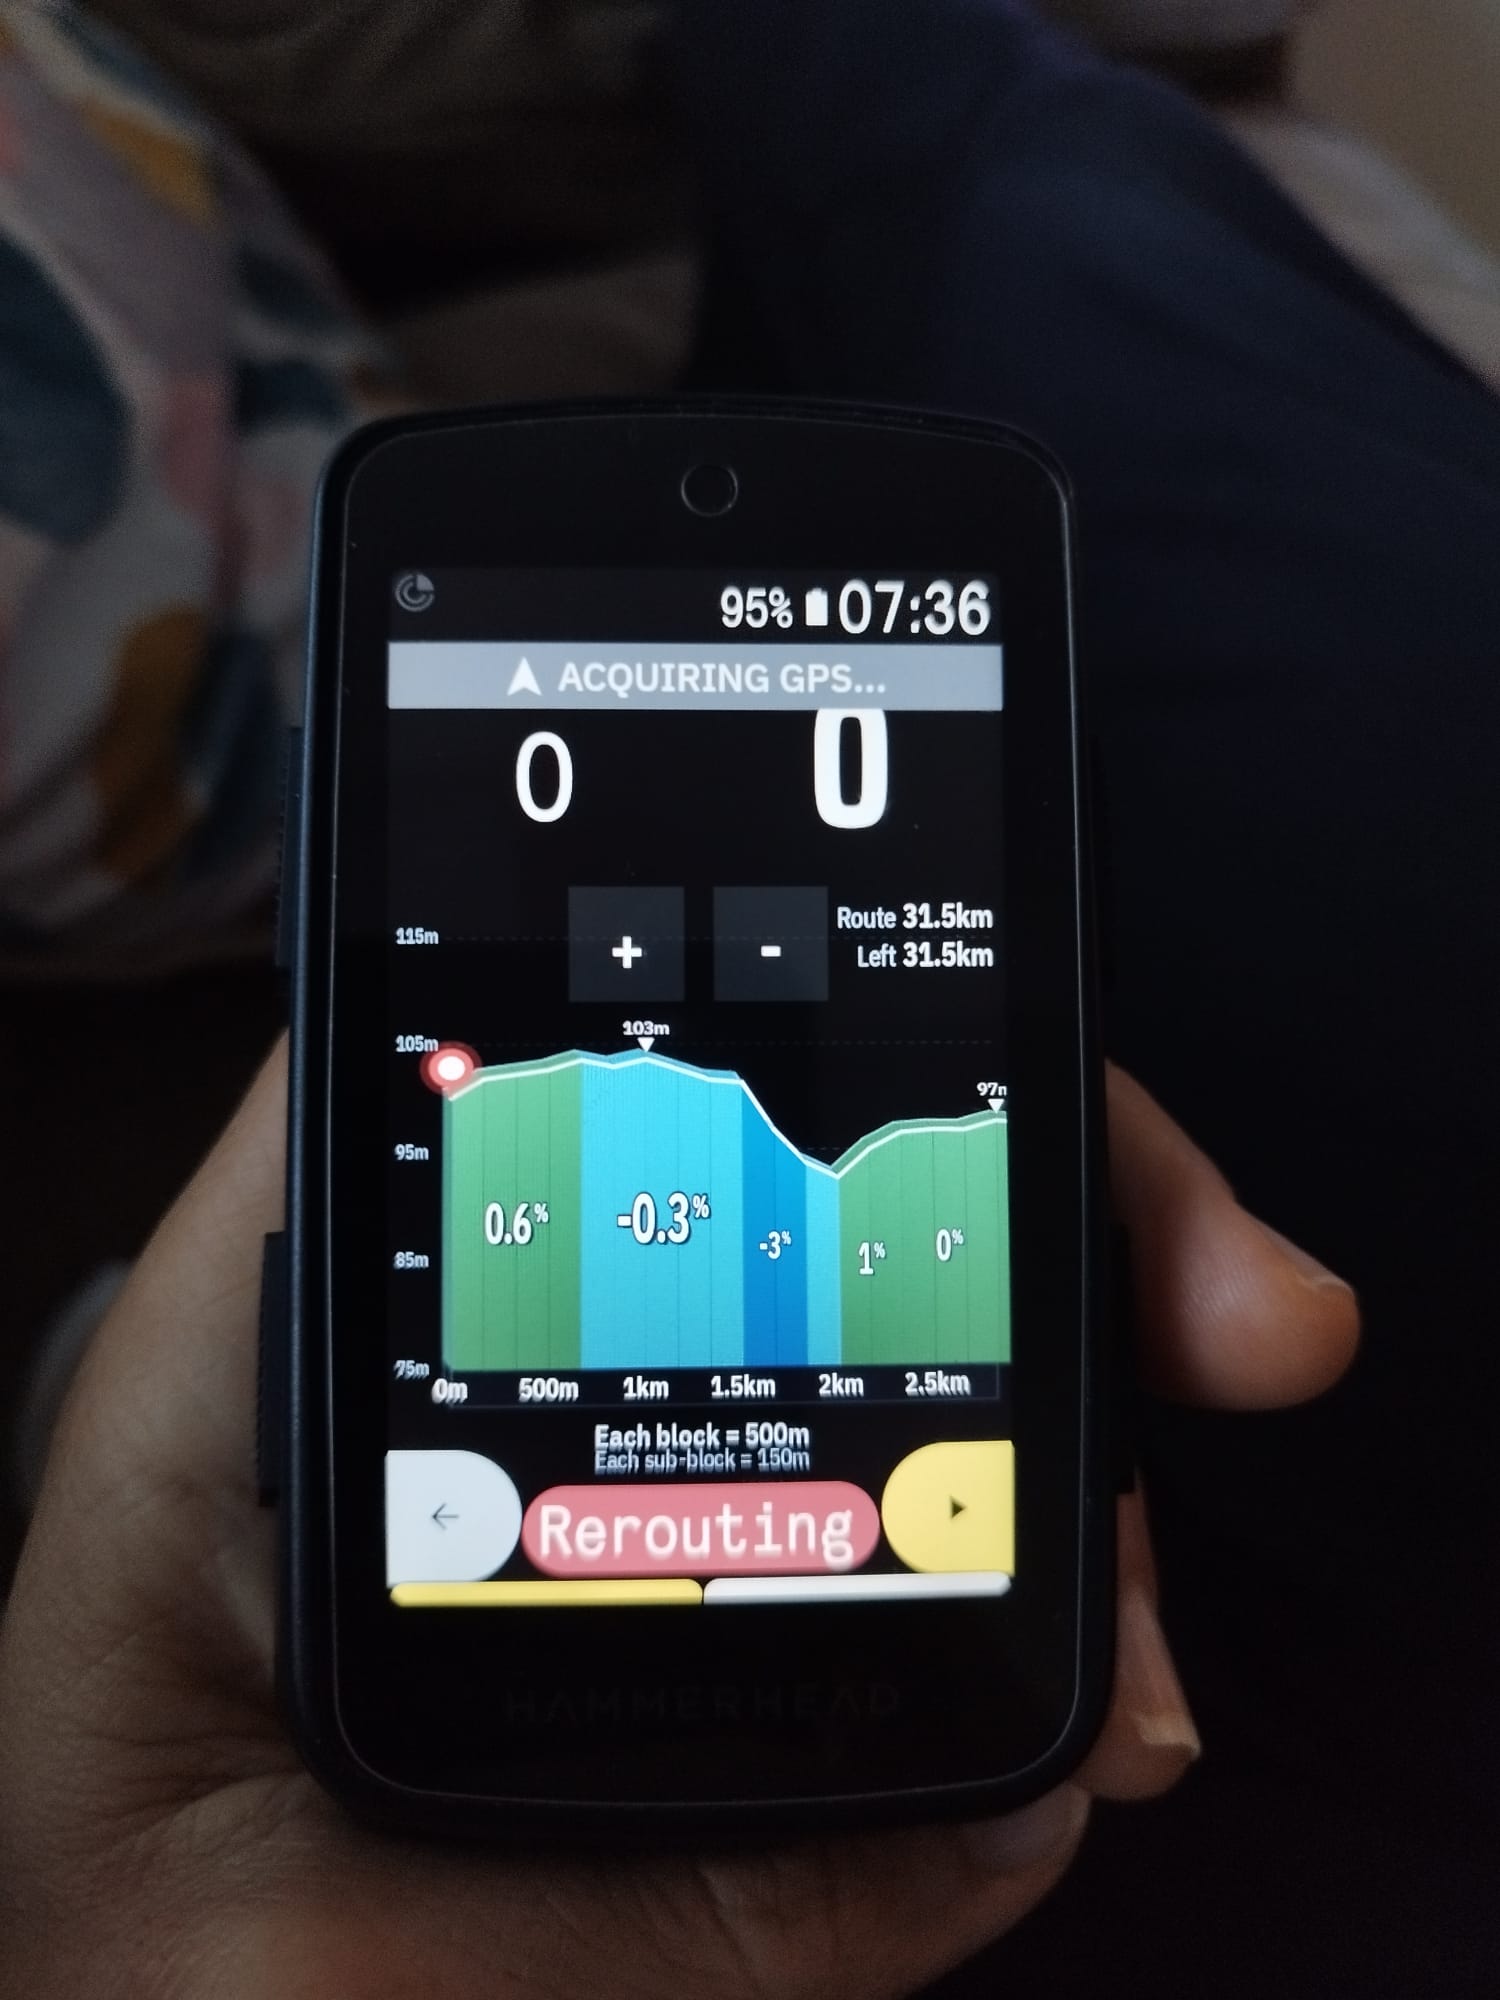
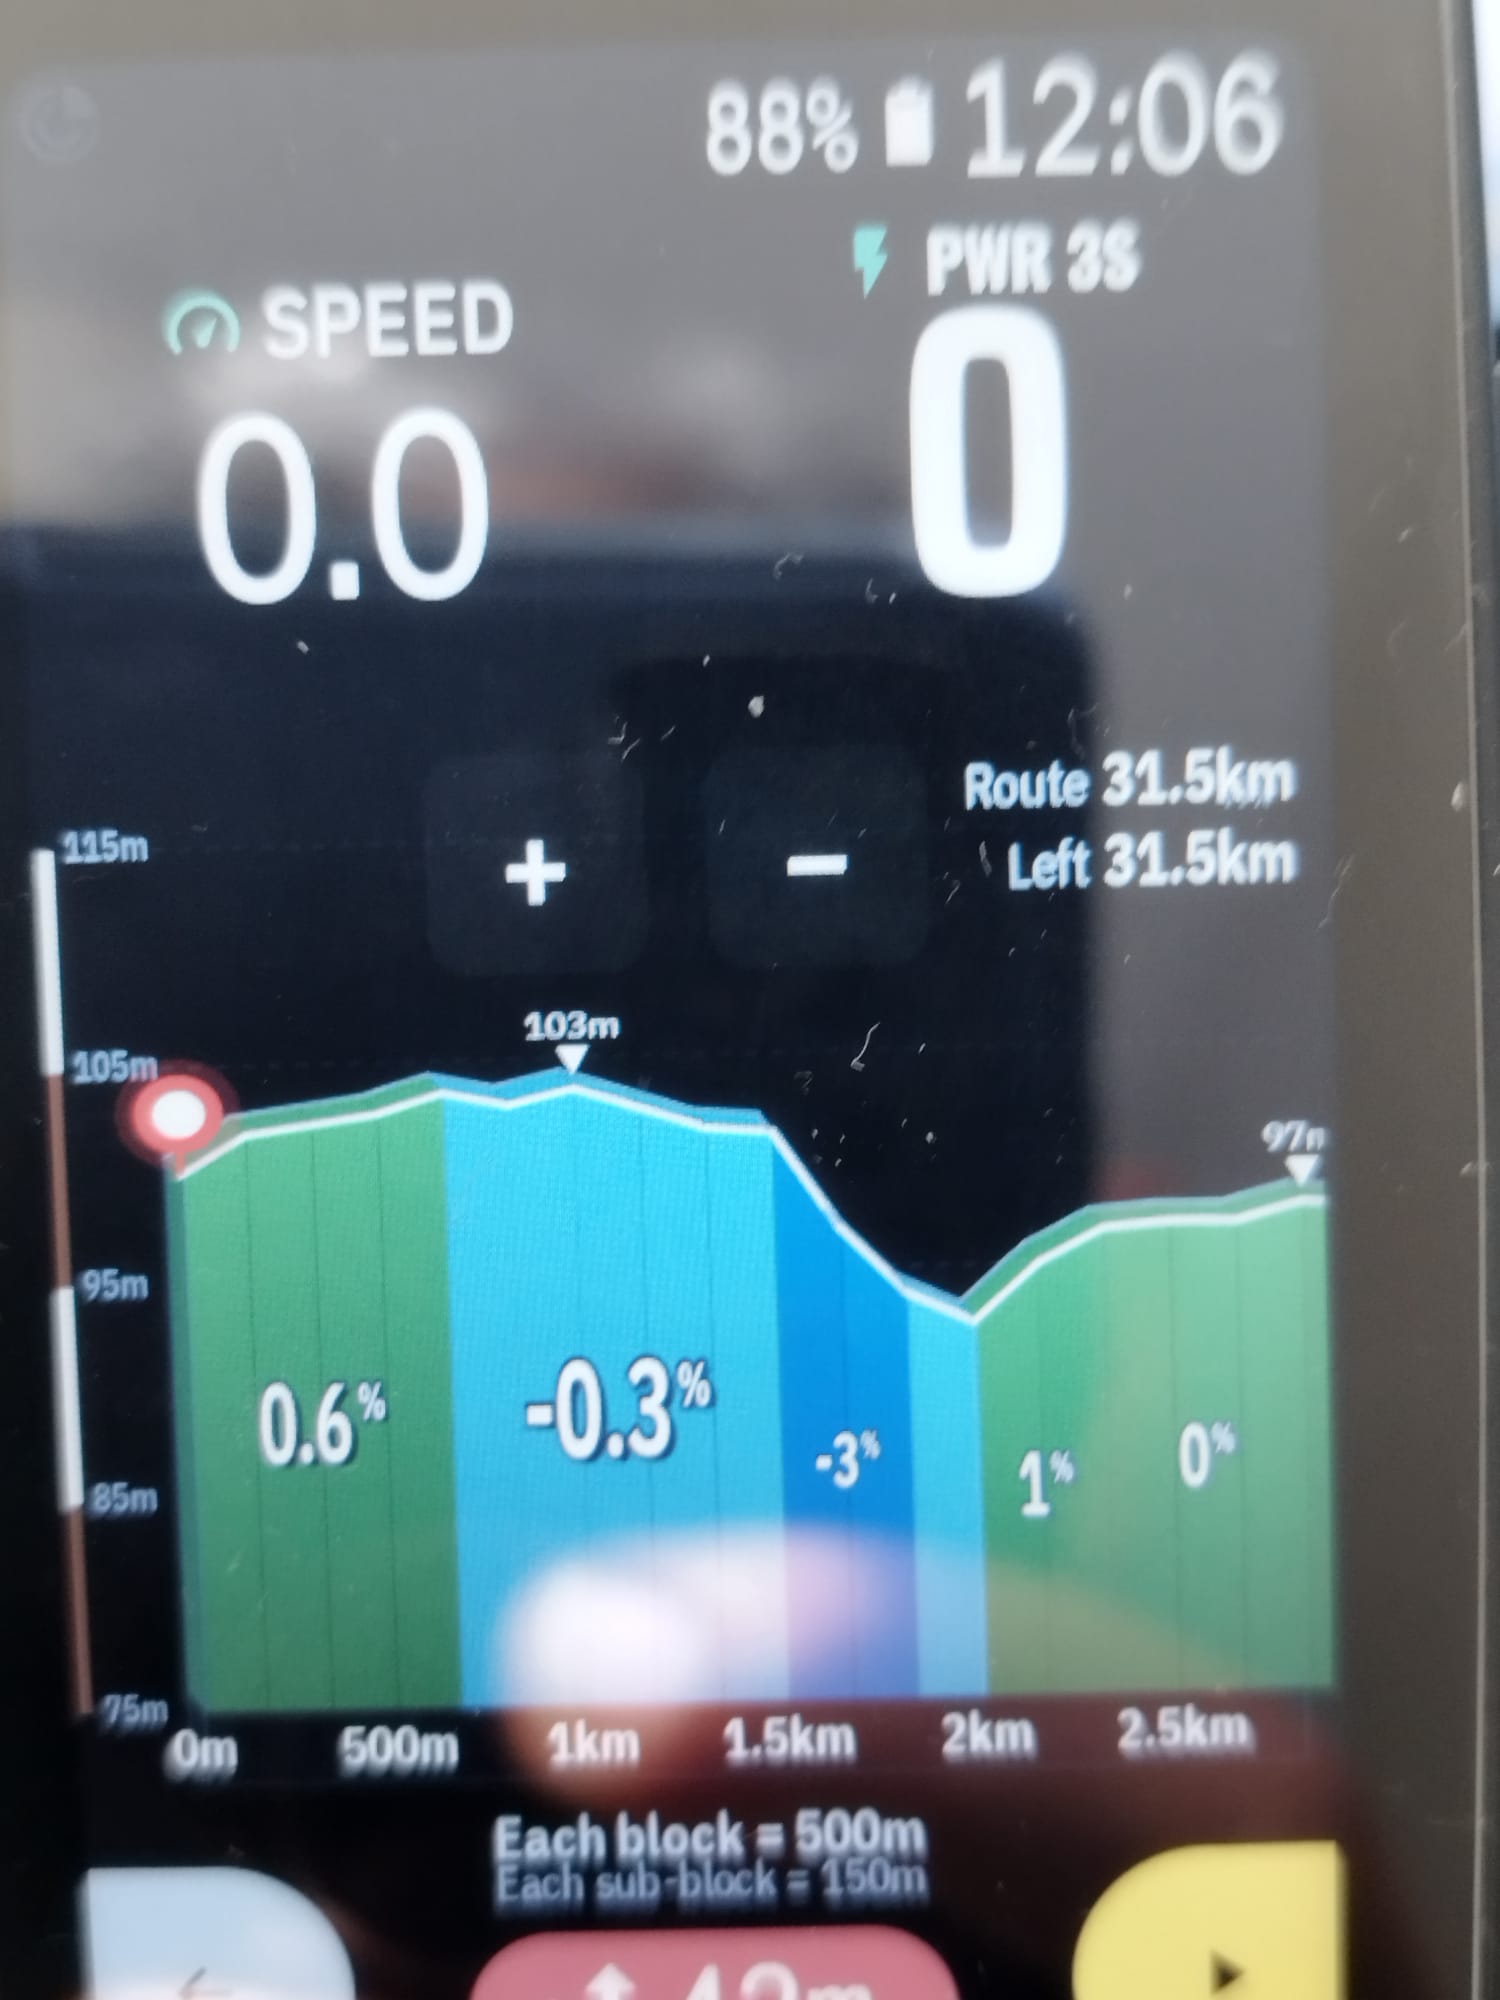
By the way, I dont mean to sound picky but I'd personally remove the bar (white and brown) next to the elevation. In my opinion, adds no value to the rider and it is much cleaner looking without it. Perhaps make it optional? Or am I now asking for too many things? I do not want to test your patience :-)
-
Back and I have some feedback.
The "y-axis fits the elevation in the visible window instead of using a fixed span" did not work very well for my route today. I thought it was overstating little 2% or -2% small segments of the road, making some 3% segment looking like climbs when they were more like drags. However, at the end of the route, it kind of liked how it looked which it is odd as it was not looking anywhere remotely like that till that point. It seems it changed once the ribbon moved from the 20% to end the route. Odd!
So changes which I'd make.
Settings:
headroom = 0.7
vertical factor = 15
floor = 30Formula
rawMin and rawMax = min and max of the elevation in the visible window, after a median filter (take the min and max after a 3 point median filter. Keep the peak marker on the true highest value.)
range = rawMax minus rawMin
minSpan = chartH times windowM divided by (chartW times vertical factor), kept between floor and 100
span = max(range divided by headroom, minSpan), rounded up to the next 5m
axisMin = ceil((rawMax minus headroom times span) divided by 5) times 5
if rawMin is below axisMin, subtract 5 from axisMin until it fits
axisMax = axisMin + spanSome more feedback. The percentages (numbers) in the yellow and orange buckets should be black, like what Karoo does as default. They are very hard to read in white colour.
Hope this is helping.
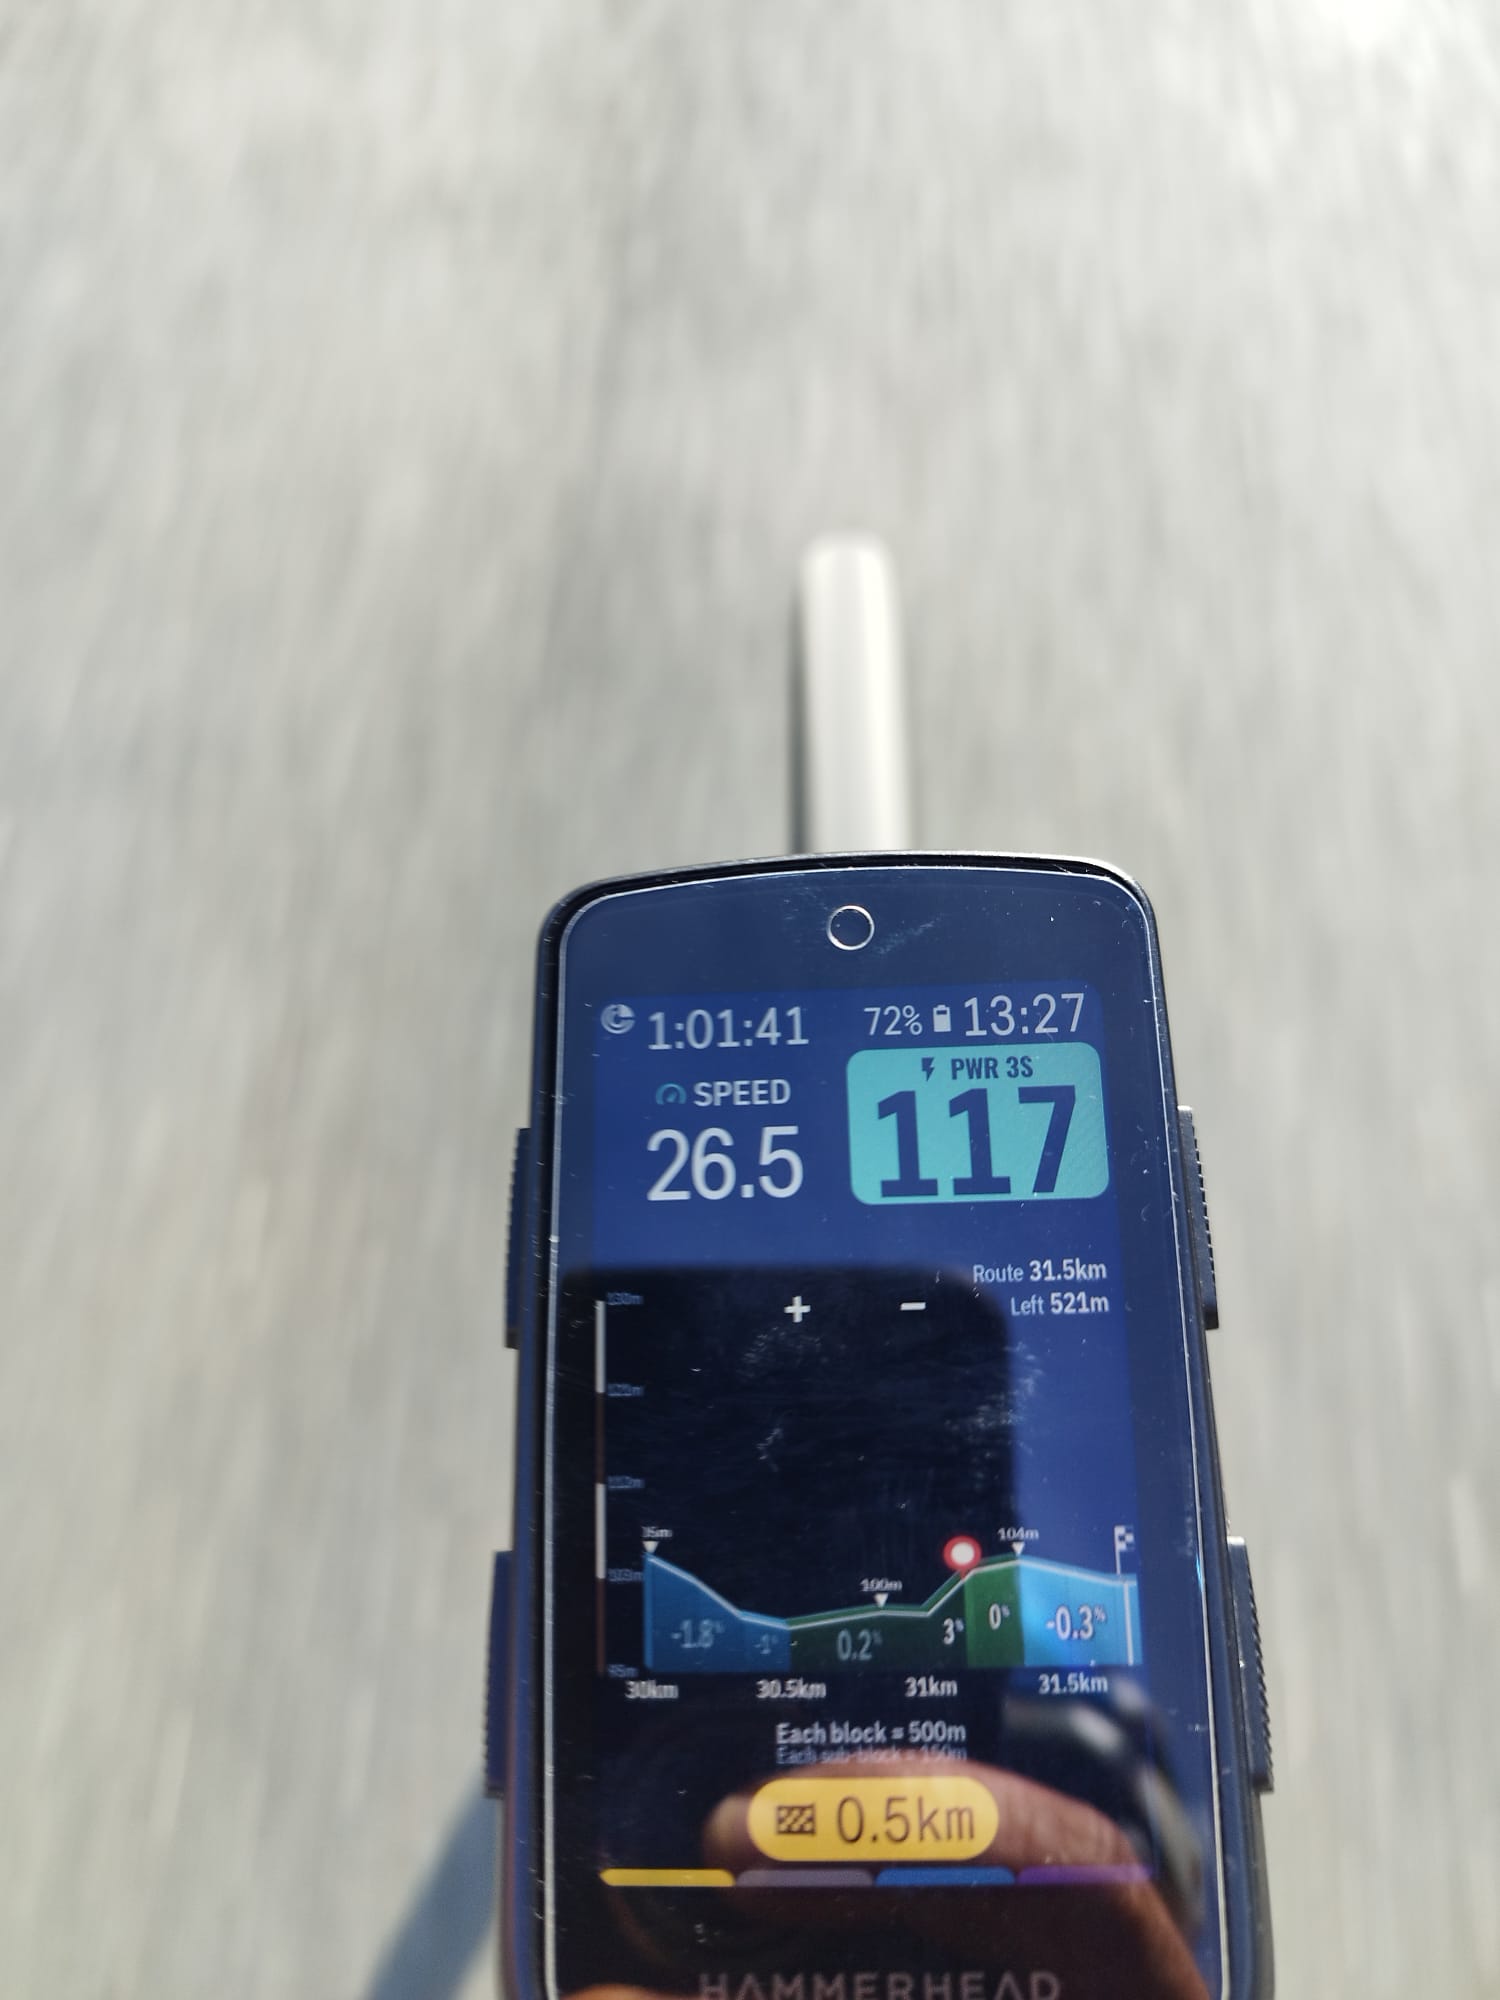
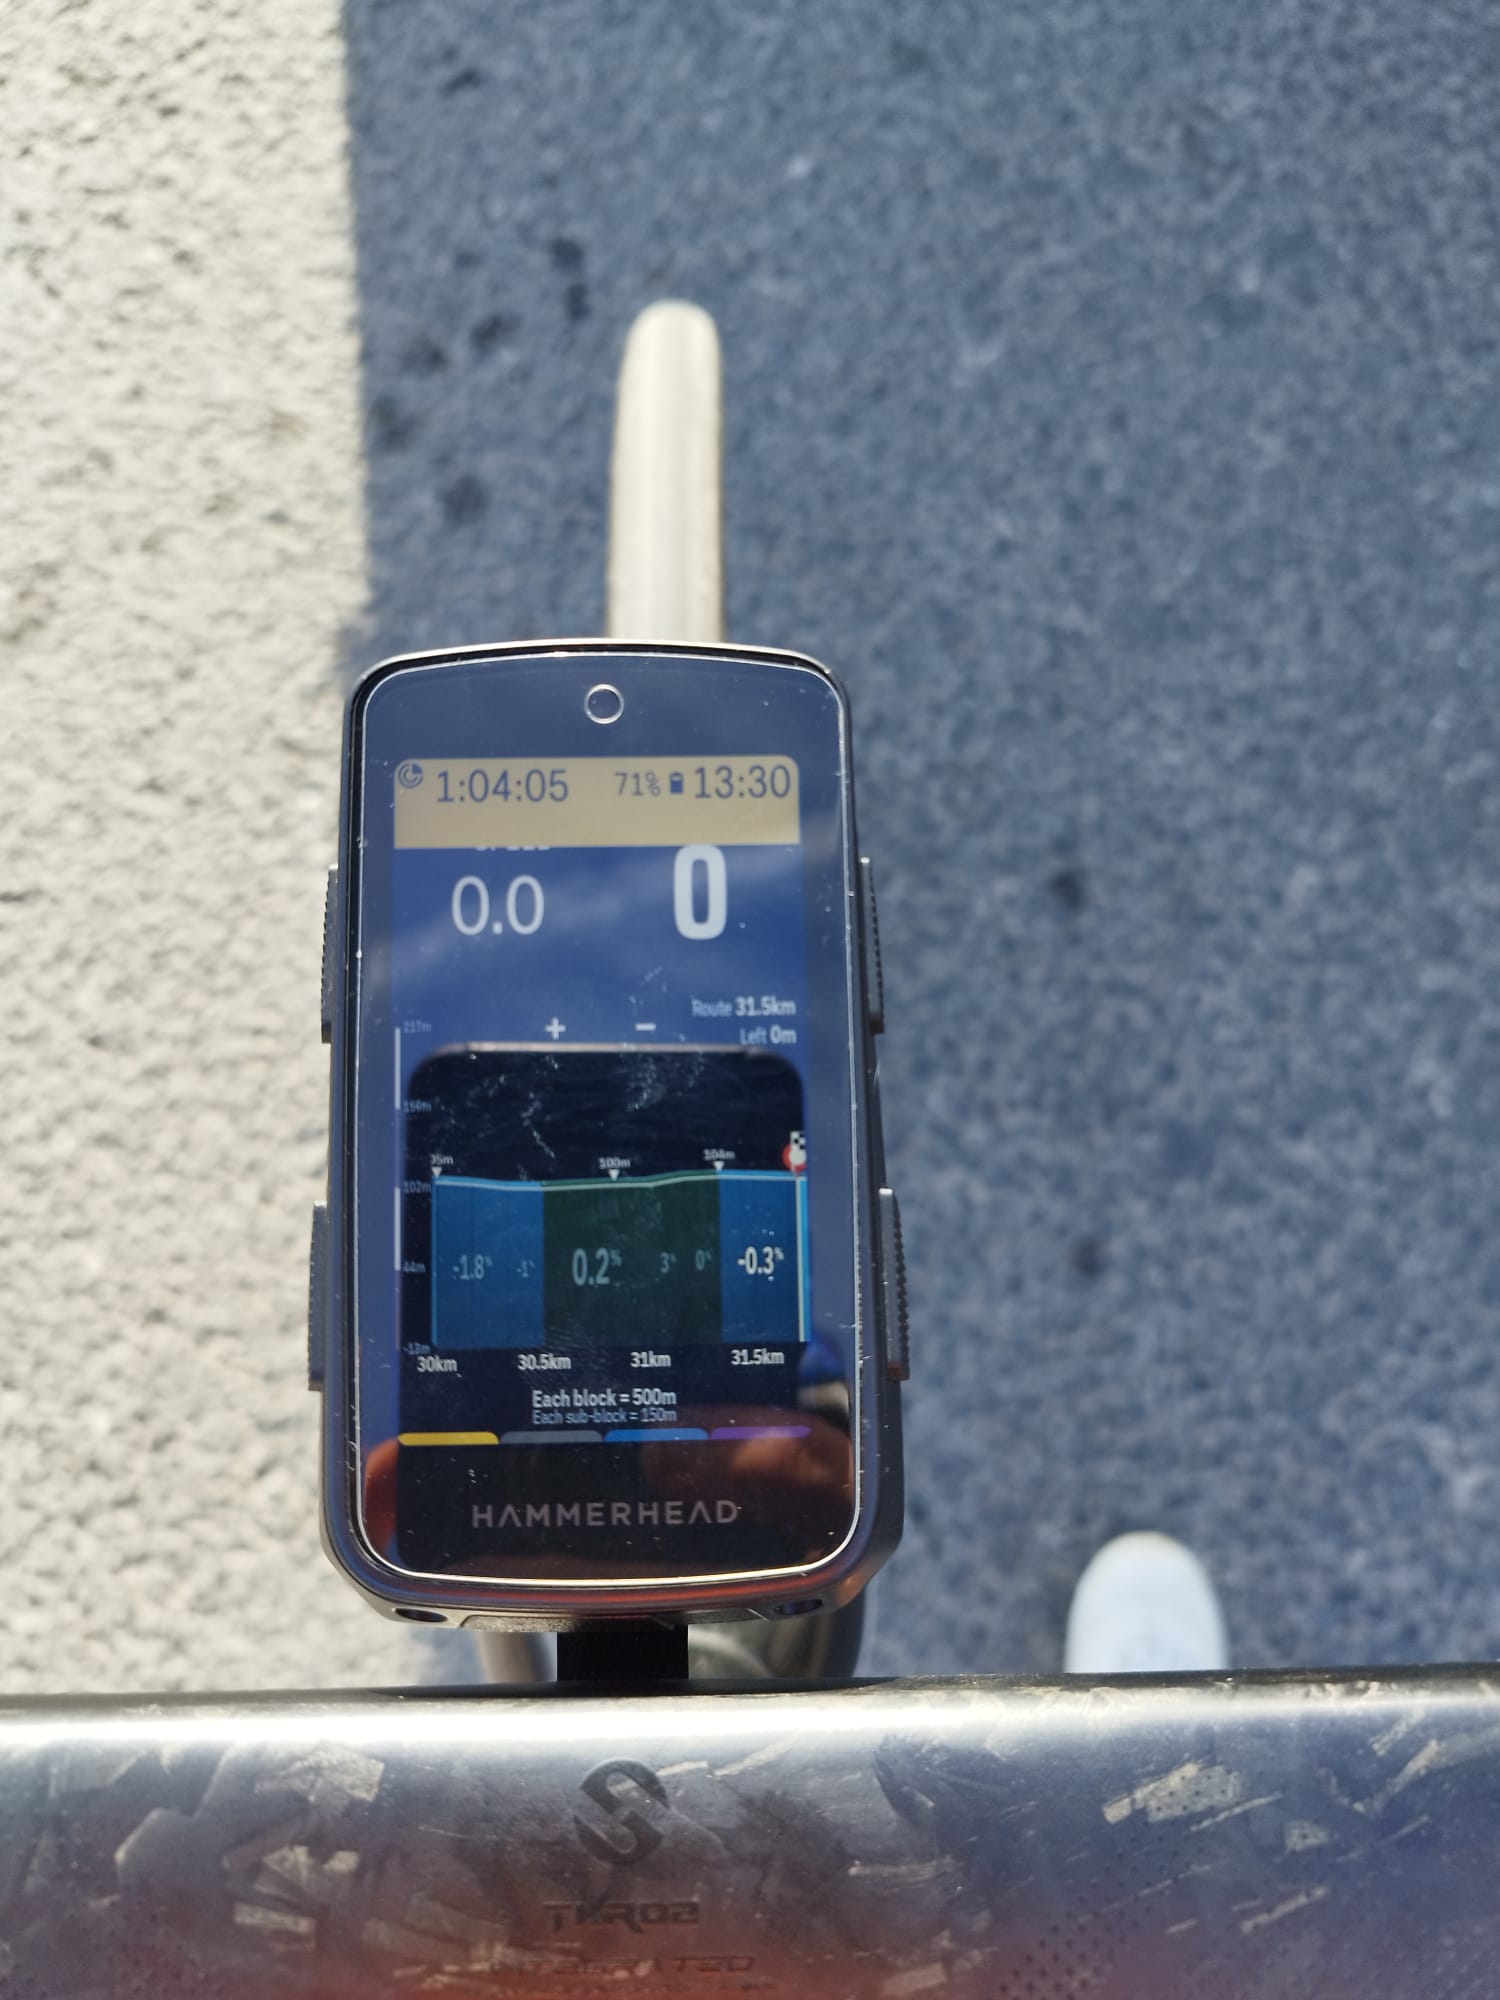
-
AltGraph v2.9.23: your feedback, and a few more things
Thanks David, and no, you're not testing my patience! Everything you asked for is in this version.
Fit-axis rework (your formula)
- The axis min and max come from the visible window after a 3-point median filter, so a single spike no longer stretches the axis. The peak marker still uses the true highest value.
-
span = max(range / headroom, minSpan), rounded up to 5 m, with the data in the upper part of the axis and some air above it. -
axisMin = ceil((rawMax − headroom × span) / 5) × 5; ifrawMinfalls below it,axisMingoes down in 5 m steps until it fits. - Defaults as you suggested: headroom 0.7, vertical factor 15, floor 30 m, span capped at 100 m. All are named constants, so they're easy to tune.
- I kept the sea level rule and the 20 % hysteresis.
- About the odd change at the end of your route.The median filter and the hysteresis should smooth that out, but please tell me how it behaves.
Gradient numbers in black on yellow and orange
- It's an optional setting in the 3D tab. It is off by default, so the white numbers stay for those who like them.
- When on, the numbers go black on yellow (3–5 %) and orange (5–8 %) blocks, like the Karoo default.
Scale bar next to the elevations
- Two new switches, one for the 3D route chart and one for the climb profile, both on by default.
Hairpin bends
- In the white background mode they were coming out white. They are now black with a white border.
Points of interest
- A new master switch, Show points of interest. When on, it opens the list of the Hammerhead POI types (aid station, ATM, bar, coffee, viewpoint, water, winery…), and you can pick which ones to show.
- Filtering now uses the real type that Hammerhead stores for each point, instead of guessing from the name.
All the new texts are available in English, Spanish, Portuguese, German, Italian and French.
I haven't tested everything on a long hilly ride yet, so tell me how the axis and the black numbers feel on your routes. Thanks again for the detailed feedback!
-
Thanks so much for the great work in this extension. This is looking awesome!
A quick one whenever you get a chance. Could you please make the banner at the bottom of the 3d graph optional? I mean the one which says each block = x , each sunblock = X. It'd be great to gain a bit of "field space" not showing it. The idea is that if not showing the rest of the 3d graph would gain that space not that it'd be left blank if that makes sense.
I'll test the v.3 later today on the road.
-
The new logic worked sort of ok but needs some refining. Please see if you could make sense of the below.
I tested the latest build on a full ride. Most of it looks good, but on climbs the profile sometimes sits too high, with the peak and its label almost on top of the zoom buttons. In two of my screens the profile sat nicely, with the peak at about 40 to 45 percent of the chart height, and I would like that to be the normal case. I would even like it a bit lower. Here is what I would like to change.
Settings (all easy to change)
placement = 0.4, please let me test 0.35 to 0.45
cap = 0.65
vertical factor = 15, please let me test 10 to 20
floor = 30Formula
rawMin and rawMax = min and max of the elevation in the visible window, after a median filter (see change 2)
range = rawMax minus rawMin
minSpan = chartH times windowM divided by (chartW times vertical factor), kept between floor and 100
span = max(range divided by cap, minSpan), rounded up to the next 5m
axisMin = ceil((rawMax minus placement times span) divided by 5) times 5
if rawMin is below axisMin, subtract 5 from axisMin until it fits
axisMax = axisMin + spanWhat this does. On flat and rolling routes the floor sets the span, and the peak lands at about 40 percent of the chart height. On hilly and mountain routes the data needs more room, so the peak rises, but never above about 65 percent.
Changes from the last version
1. Two settings instead of one. Before, a single headroom value of 0.7 set both where the peak sits and how much extra span big routes get. These need different numbers. Placement controls where the peak sits on a normal route. Cap controls how high it can go on a route with a big elevation range.
2. Clean the elevation first. One bad GPS or barometer reading, such as a tunnel or a bridge, stretches the range and flattens everything else. Take the min and max after a 3 point median filter. Keep the peak marker on the true highest value.
3. Refit sooner. Keep the current axis while the raw min and max stay inside it, but refit as soon as the peak goes above 70 percent of the chart height. The old limit of 85 percent was too late. That is where the zoom buttons start to cover the profile, and it is what I saw on climbs. Also refit when the data leaves the axis, or when the new span differs from the current span by more than 20 percent.
4. Keep the peak label clear. The top of the peak label counts as part of the profile. It must stay below the zoom buttons, which cover about the top 15 percent of the chart. If the label would reach the buttons, draw it to the side of the peak marker. Please also consider moving the buttons off the chart, since that fixes the root problem.
5. Labels. Show three y labels only, rounded to the nearest meter, so a span such as 125m does not produce a label like 892.5m. Stop the fill at axisMin. In my last test I still saw five y labels.
6. Sea level rule. If rawMin is at or above 0, set axisMin to the larger of axisMin and 0, then set axisMax = axisMin + span. If rawMin is below 0, skip this. On routes very close to sea level this can push the peak above 40 percent. Please check that case.
Add as an option a Tag
Please show the vertical exaggeration under the Left distance text at the top right of the chart.
exaggeration = chartH times windowM divided by (span times chartW)
Show it as a small label like 15x. It is the only thing that tells the rider how stretched the picture is.
-
Thanks a lot for the detailed feedback and the great suggestions! Here's what's coming in the next update:
Optional bottom banner
The "each block = X / each sub-block = Y" legend can be hidden in Settings. When hidden, the 3D chart uses that space instead of leaving it blank.Vertical axis ("fit axis") refinements
- Two separate settings now: placement (0.4, where the peak sits on a normal route) and cap (0.65, the highest it can rise on routes with a big elevation range).
- The axis refits as soon as the peak goes above 70% of the chart height (it was 85%), or when the data leaves the axis, or when the span changes by more than 20%.
- Elevation is cleaned with a 3-point median filter before computing min/max, so a single bad GPS or barometer reading no longer flattens the chart. The peak marker still uses the true highest value.
- Only three Y labels are shown, rounded to the nearest meter.
- Sea-level rule: if the route has no negative elevations, the axis never goes below 0 m.
Peak label vs. zoom buttons
If the peak label would reach the zoom buttons, it is now drawn to the side of the peak marker.Vertical exaggeration tag (optional)
A small label such as "15x" is shown at the top right of the chart. You can turn it on or off in Settings, in the 3D tab next to the fit-axis option.Zoom buttons
The + and − buttons are now slightly closer together.I haven't moved the zoom buttons off the chart yet, but I'll consider it for a later version. Please let me know how it feels on the road, and feel free to try other placement values (0.35–0.45) and vertical factor values (10–20)!
-
Hi David, thanks a lot for testing and for the detailed photos, they were very helpful!
v3.0.1 is now released. It includes everything we discussed:
- Optional bottom banner: hide the "Each block = … / Each sub-block = …" legend in Settings, and the chart uses that space.
-
Fit axis, refined:
- Separate placement (0.4) and cap (0.65).
- The axis refits as soon as the peak goes above 70% of the chart height, or when the data leaves the axis, or when the span changes by more than 20%.
- A 3-point median filter cleans bad readings, and the peak marker keeps the true highest value.
- Only 3 Y labels, rounded to the meter.
- The sea-level rule is applied.
- Peak label: if it would reach the zoom buttons, it is drawn beside the peak marker.
- Exaggeration tag (optional): a small "15x" label at the top right. Toggle it in Settings, 3D tab, next to the fit-axis option.
- Zoom buttons: the + and − buttons are slightly closer together.
The "profile goes too high and disproportionate" case from your second photo should be fixed. Please try it on a climb and tell me how it feels. The zoom buttons are not off the chart yet; I'll consider it for a later version.
-
Cool. I'll be back with more feedback tomorow :-)
If the zoom buttons are removed (optinal), then it'd be cool if you could zoom in/out touching the screen. Like one touch zooms in and two touches zooms out. Not sure if this is easy implementation or not. I know you can do it in the Routegraph extension where you touch the profile graph and zooms out. However it does not have zoom in as far as I know.
-
Thanks David, great idea! Touch zoom is quite feasible: a single tap to zoom in and a double tap to zoom out, active only when the zoom buttons are hidden. The main thing to get right is keeping the drag-to-pan gesture working, so a tap isn't mistaken for the start of a drag. I'll add it to the next version, together with the option to move the zoom buttons off the chart.
Also, a quick note on v3.0.1: the first build was published with the old version number, so the update didn't show up on the Karoo. That's fixed now and the release has been rebuilt. Please check for updates again in a few minutes. Let me know if v3.0.1 still doesn't show up.
Looking forward to your feedback tomorrow, thanks for testing!
-
For zooming in and out with tapping, please have a think about it as I may have suggested it but the actions which I gave as example may have not been the best choice.
I googled it a bit and found out that perhaps this other logic below may be more feasible and logical. Looking forward to seeing what magic you come up with to make it work. I love the idea of tapping with no buttons in the graph!!!
- Double-tap: zooms in one step, centred on the tap point.
- Long-press (about 500 ms): zooms out one step. It’s a single finger, doesn’t clash with double-tap, and is rarely used for anything else in a zoomable view.
- Reset: double-tap while at maximum zoom returns to the default level, so nobody gets stuck.
Note: hopefully long press does not trigger any other action. It'd need to be tested. If it does then we are back to the single and double tap option :-)
-
Thanks David, great research! I looked into it and there is a technical limit. On the Karoo, the profile is shown as an image inside a remote view, and that only reports a plain tap. It can't tell a double-tap, a long-press, or where on the screen you touched. So double-tap, long-press and "centred on the tap point" aren't possible as described.
I built something close to your idea, with tap timing in the app:
Tap: zooms in one step, instantly.
Quick second tap (within about 0.4 s): undoes that zoom-in and zooms out one step from where you were.
Tap at maximum zoom: goes back to the default zoom level, so nobody gets stuck.
It works when the zoom buttons are hidden, and only on the global 3D profile for now, not the climb viewer. The zoom steps are the same as the +/− buttons.It's released in v3.0.3. Please update to 3.0.3 and let me know how it feels on the road. If you'd rather have taps on the left and right halves of the chart, that's easy to bring back.
-
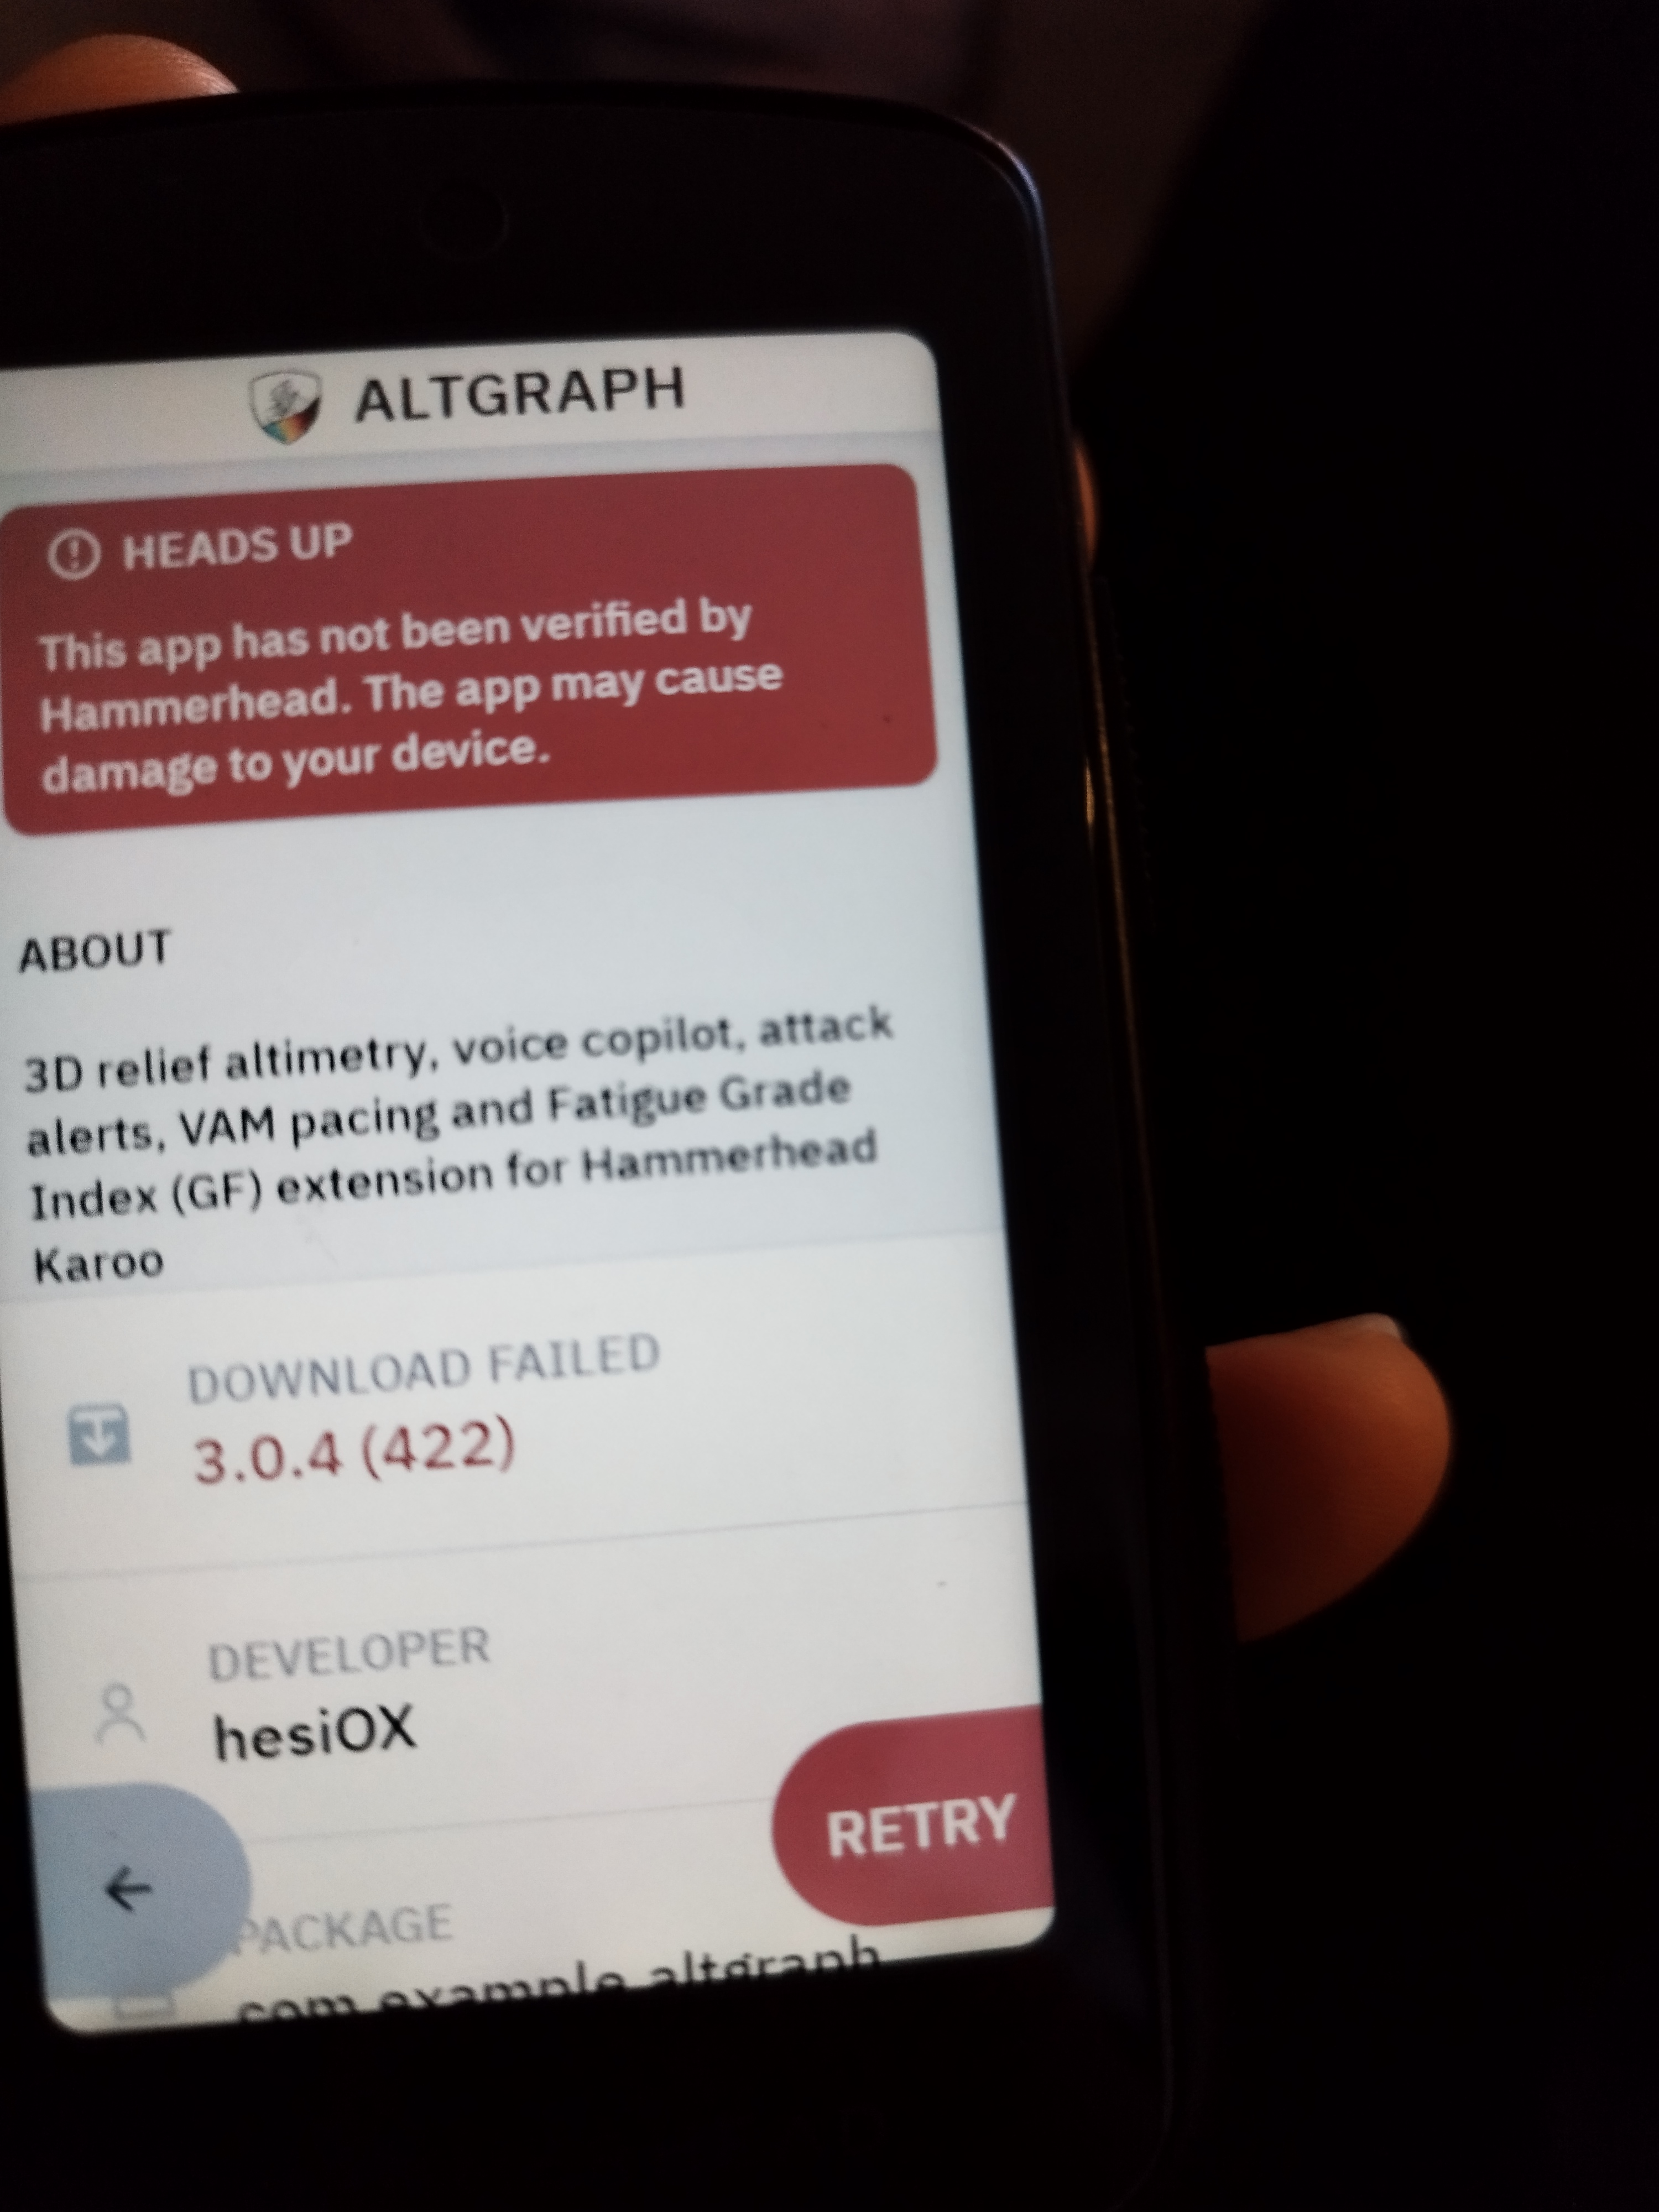
Hi,
Thanks for the screenshot. It helped me find the problem. The extension's listing file had a typo in the download link (stray spaces), so the Karoo couldn't fetch the APK. That was my mistake, and I've fixed it.
To get it back:
- Open the ALTGRAPH page in the Hammerhead app and tap Retry, or search for it again and reinstall.
- If it still fails, wait a few minutes and try again, since the fix can take a little while to reach your device.
If you need it right now, you can sideload it: download
app-release.apkfrom the v3.0.4 release and install it on the Karoo.Sorry for the trouble, and thanks for reporting it. Let me know if it still doesn't work.
-
Thanks for that. It is now all good! Brilliant.
Few things.
1- The exaggeration number needs to go somewhere else as it is overlapped by the distance numbers.
2- When elevation stats are added to the distance stats. These numbers become too small to read. My suggestions would be to make them all bigger
3- Question. Could you make an option to swap and put different metrics instead of current %, average % and max %? I love how they look over the elevation graph but those 3 metrics do not add much value to me (a part from current %). In my ideal world these 3 would be Current %, Route km and Left Km. That'd be a killer! But only throwing ideas for you.Also, when those are on the elevation max goes to 145m Vs 160m. How is that?
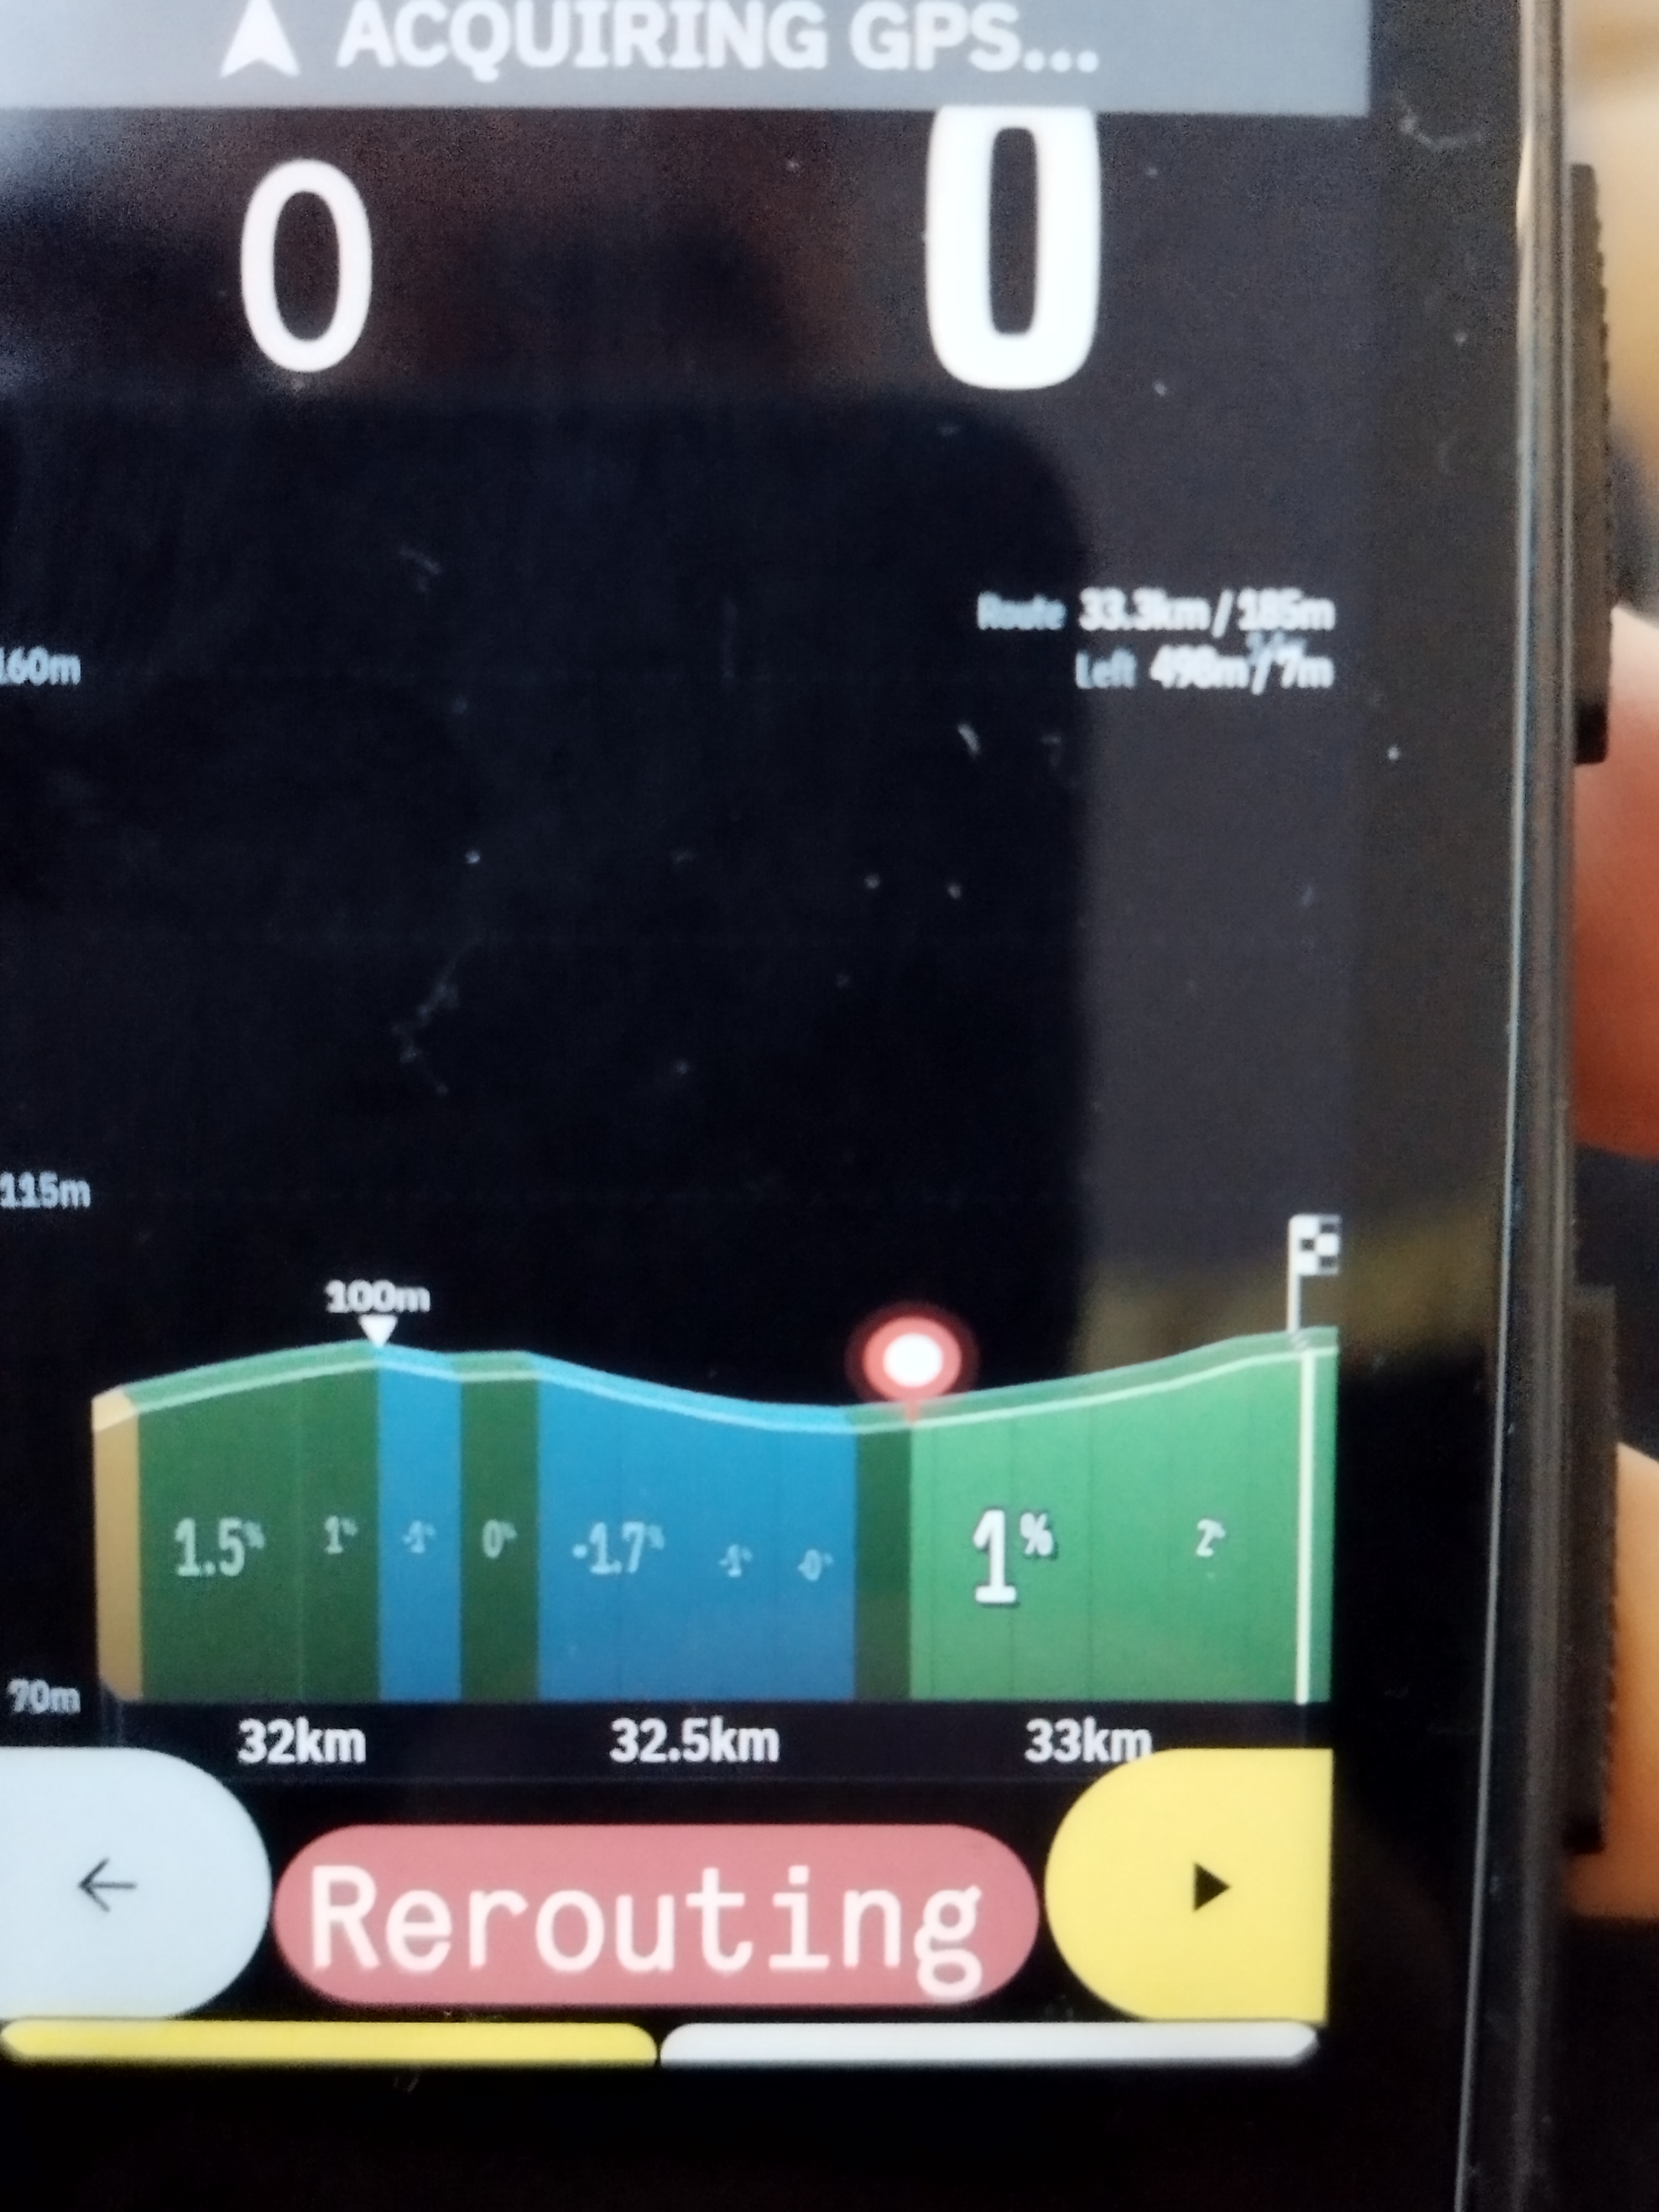
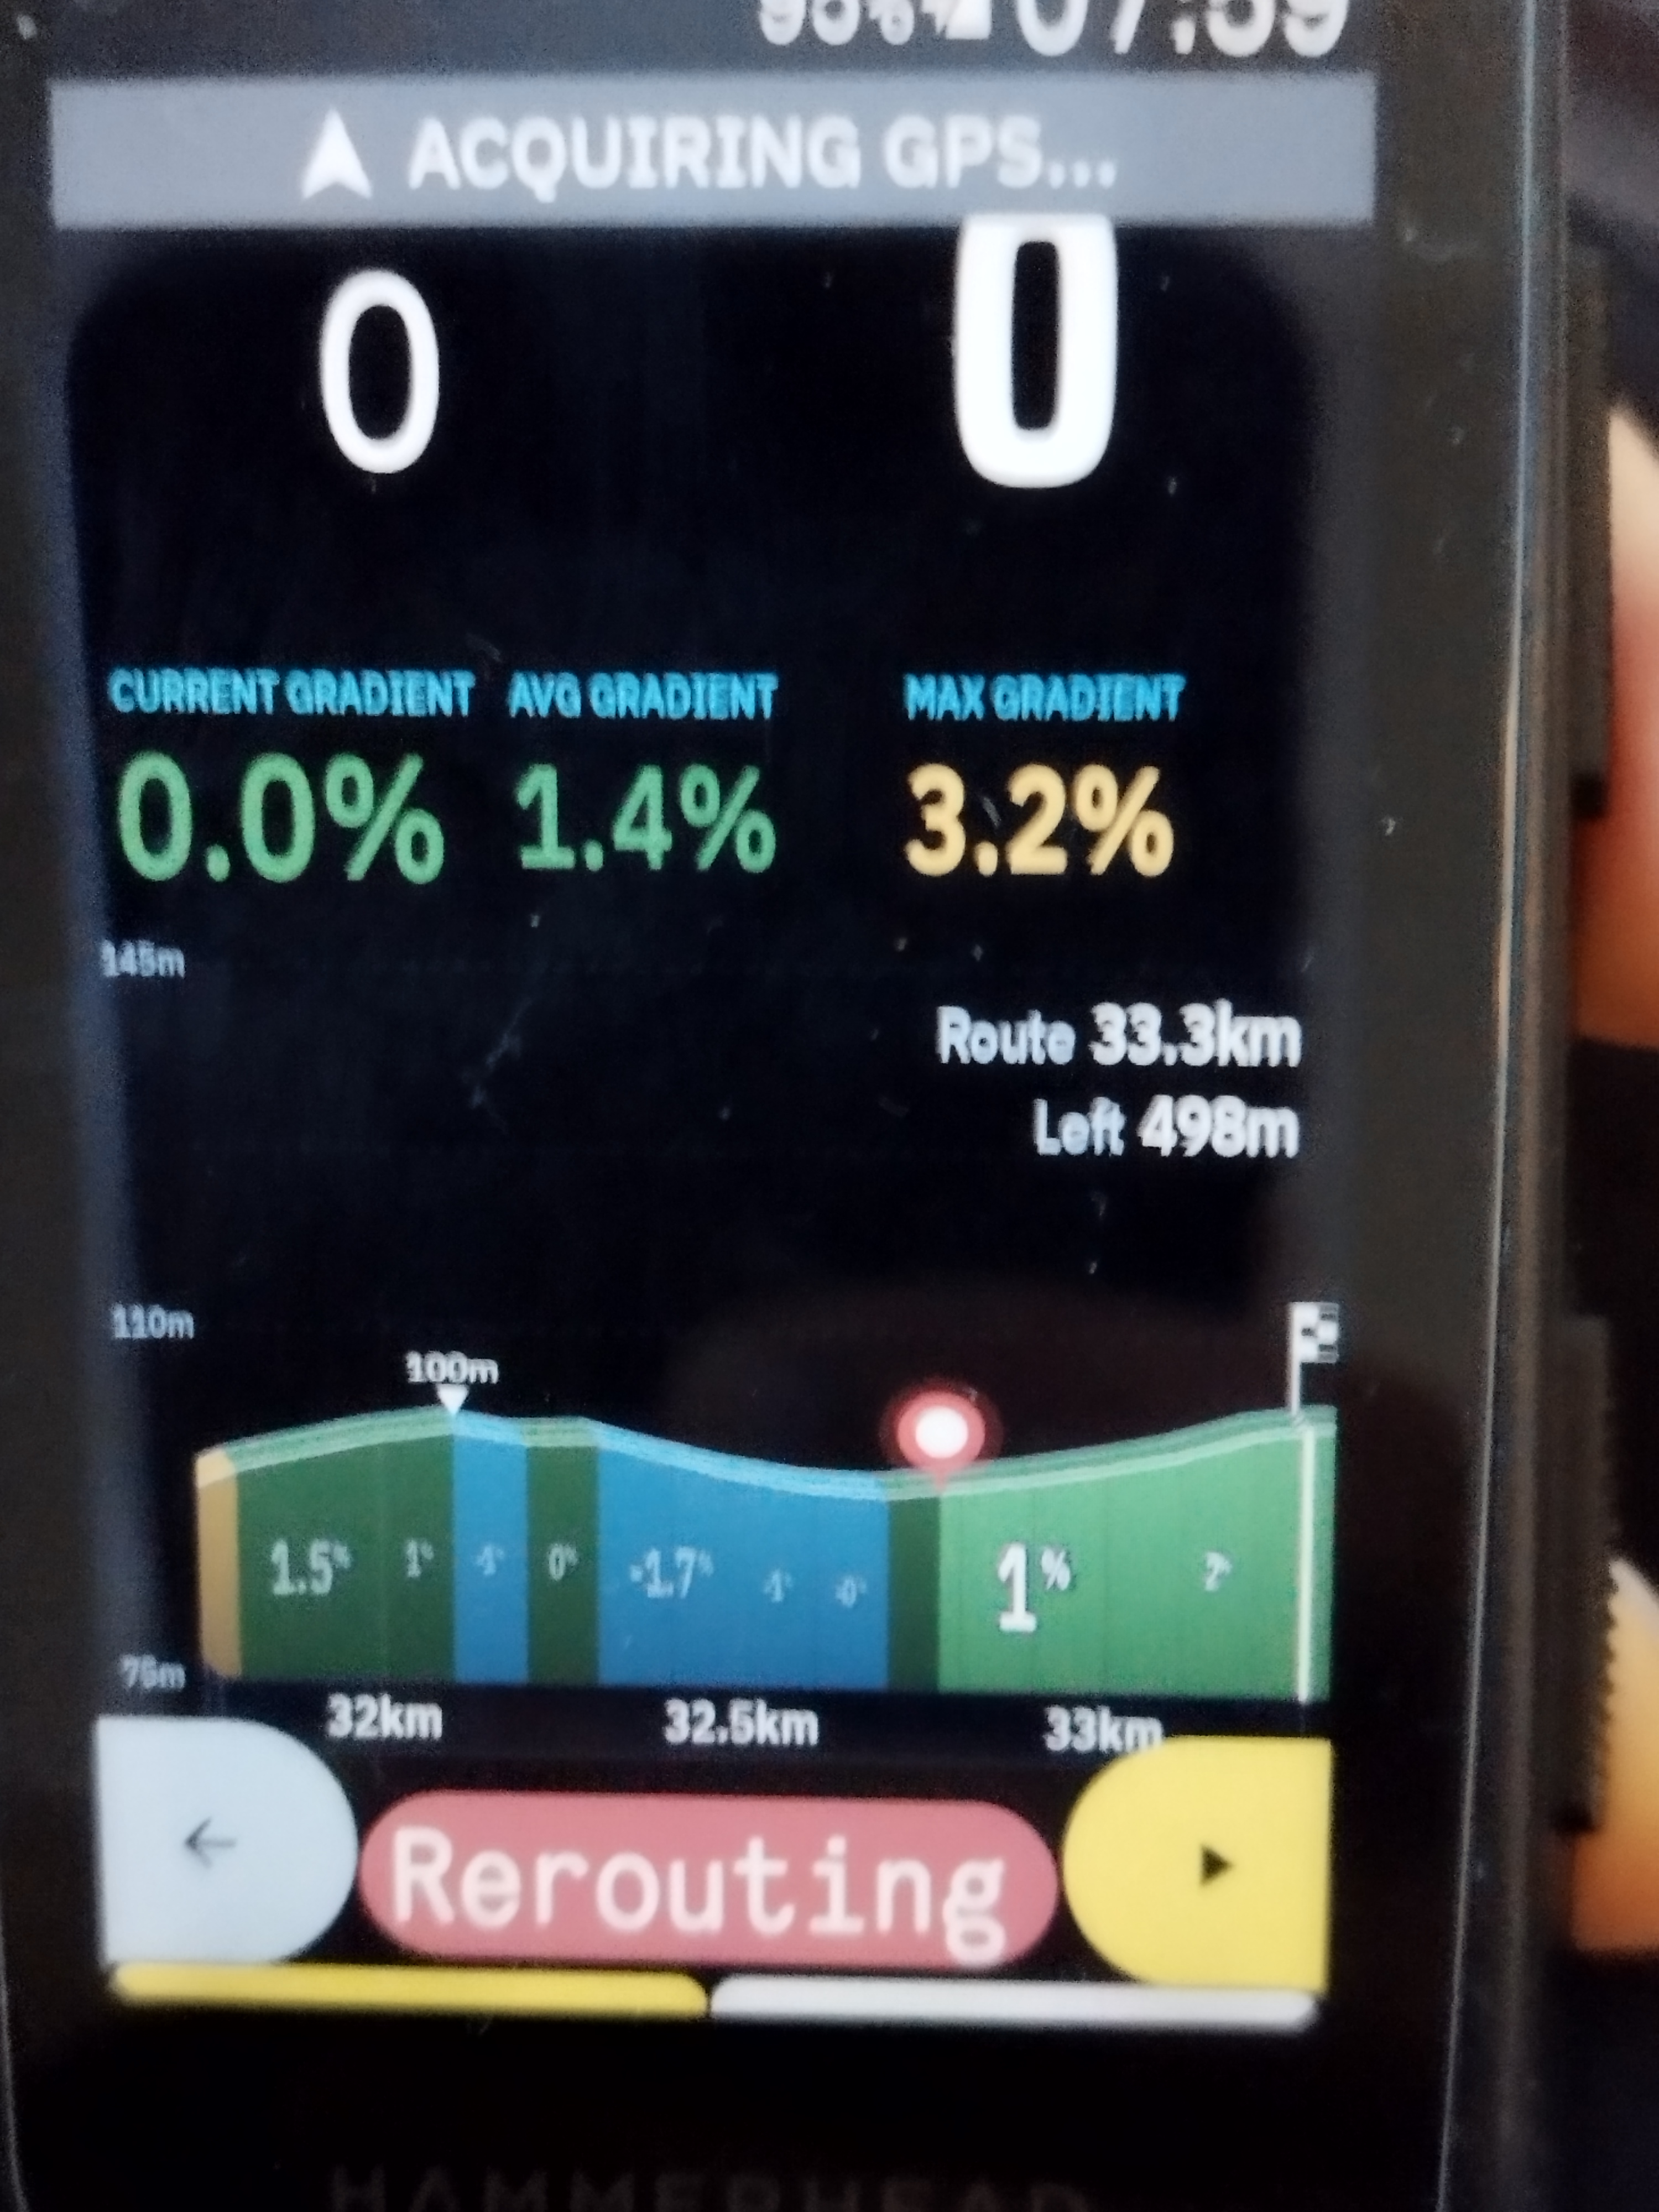
-
Hi,
Glad the install is sorted, and thanks for the detailed feedback. I've put your suggestions into v3.0.5, which is now on GitHub and should show up as an update in the Hammerhead app.
What changed
- Exaggeration number: when the route distances are on the right, the exaggeration tag moves to the top-left, so the distance numbers no longer cover it.
- Bigger distance numbers: with elevation stats added, the distances now sit under the top line of the graph at full size instead of being squeezed small.
-
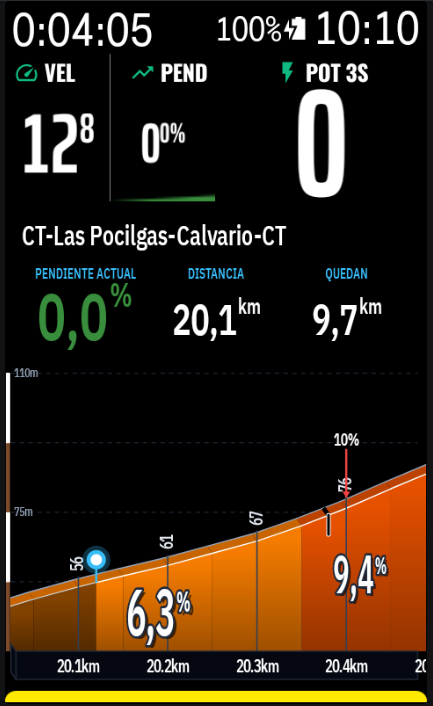
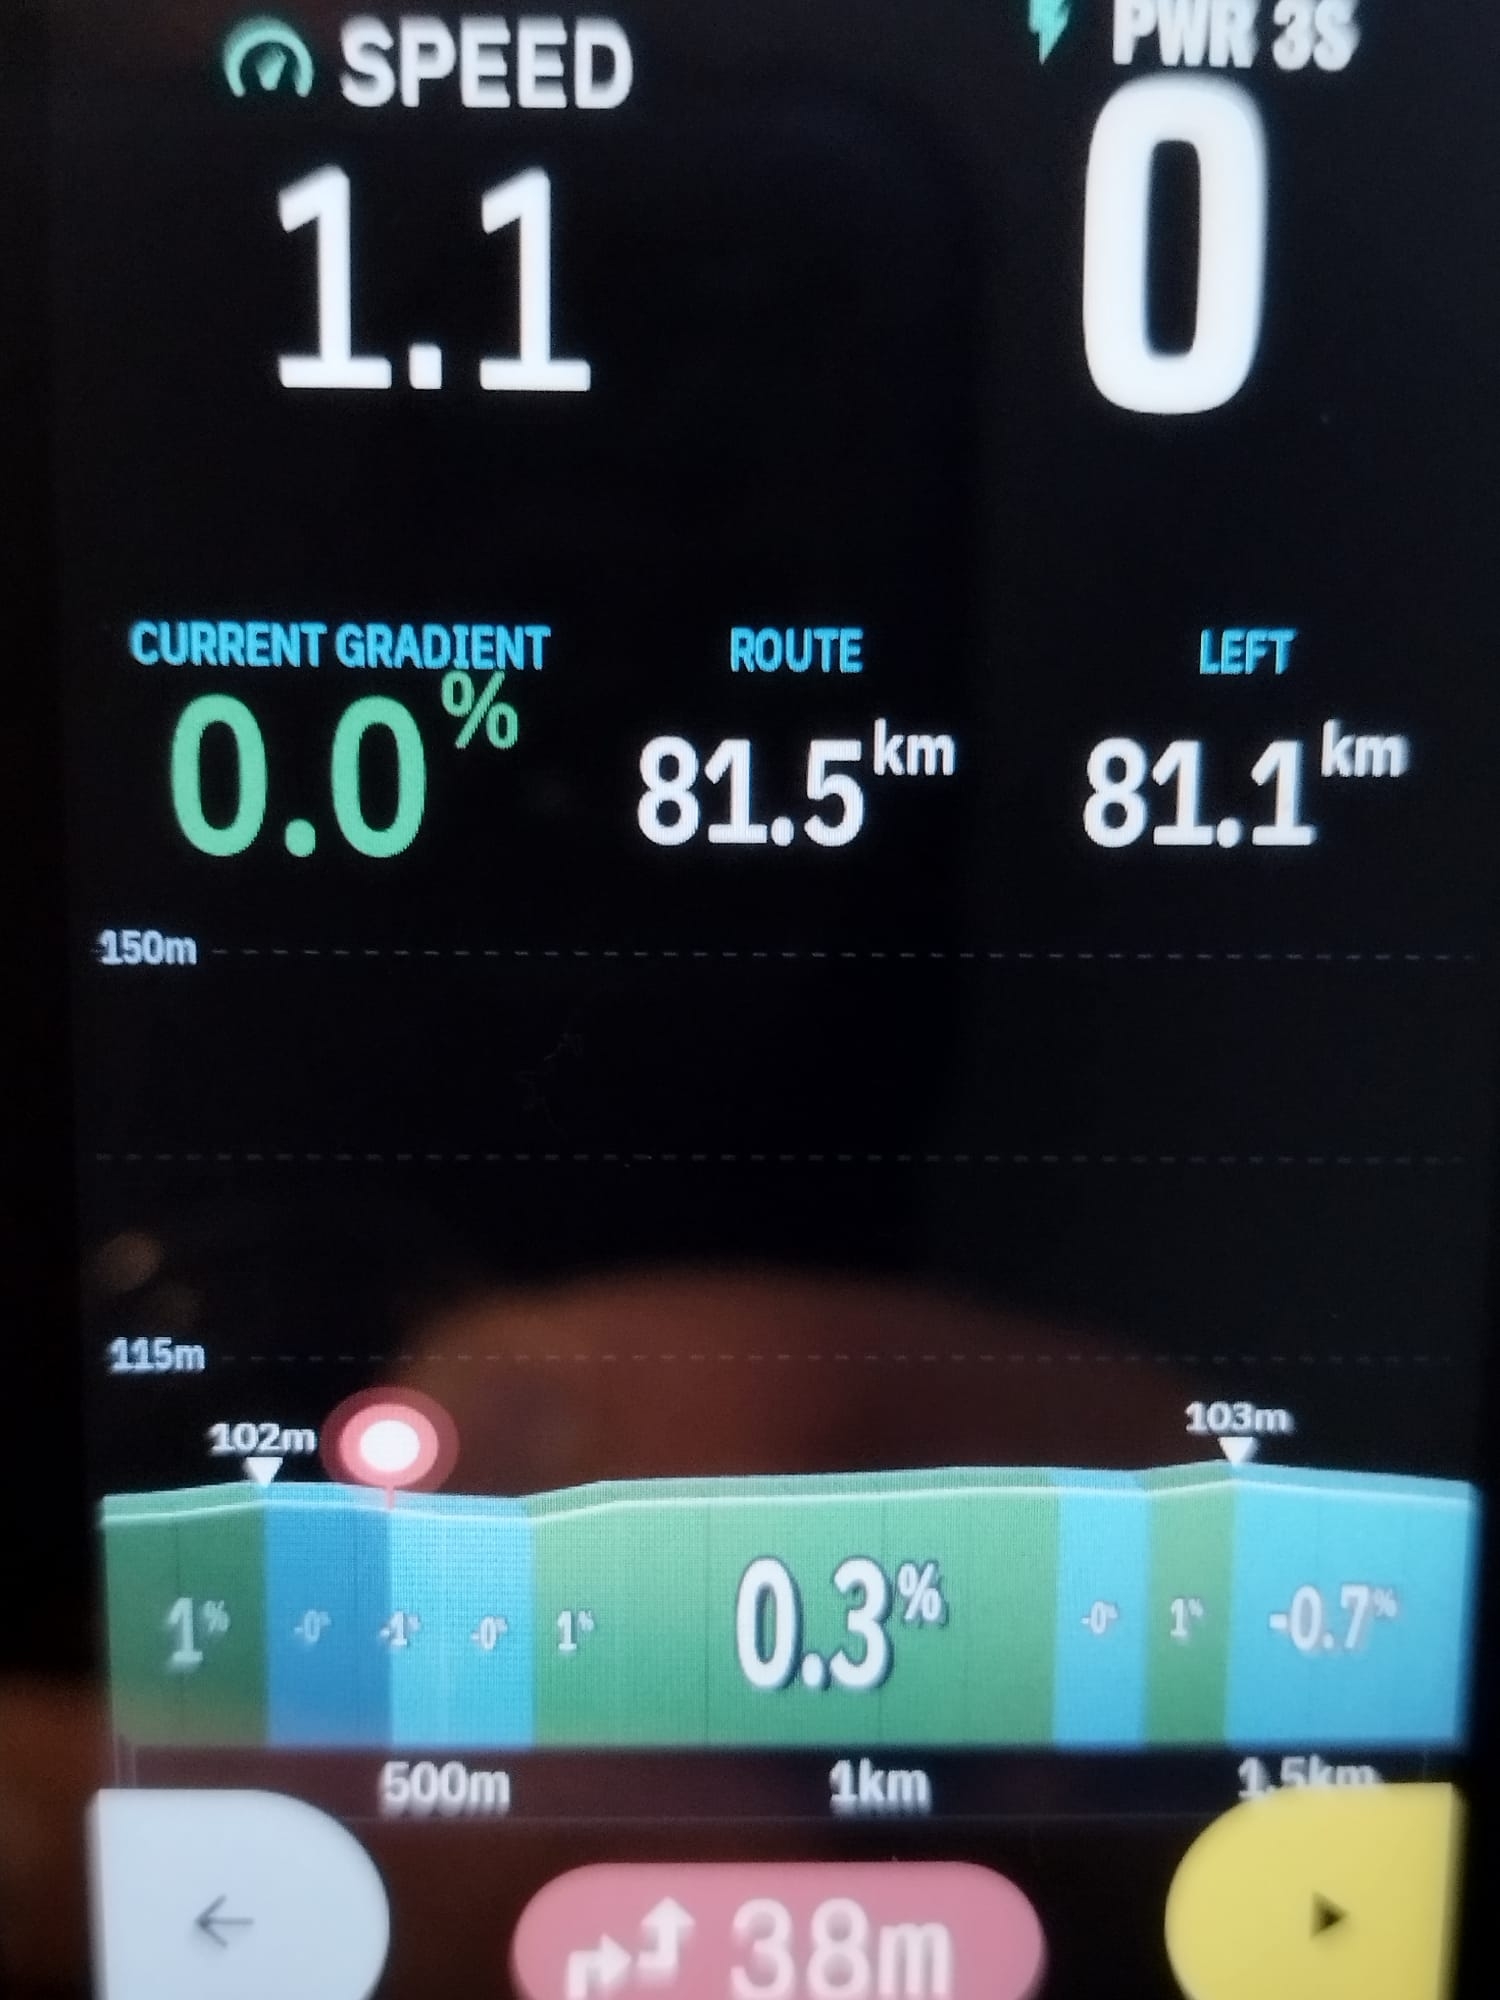
Choose your header metrics: the three header columns now have a dropdown each, in the 3D tab. You can pick from Current %, Avg %, Max %, Route km, Left km and Distance covered km. Your ideal setup of Current % / Route / Left is possible, and the defaults haven't changed.
- The unit (
%,km) is now small and raised, like an exponent, so the numbers can be larger. - Route, Left and Distance are a bit smaller than the current gradient, so 100+ km routes still fit in portrait.
- Each column is centred, and units follow your metric or imperial setting.
- The unit (
Why the max elevation went from 160m to 145m. This is by design. With the header on, the chart is shorter, and the vertical range scales with the chart height to keep the same exaggeration. Nothing is wrong with your data.
Also fixed
- Smoother axis readjust: the vertical axis used to jump down suddenly once the peak got near the top. It now adjusts gradually as you ride, and the profile can reach the fourth altitude mark before it adjusts.
- No white strip: the route profile now starts right at the altitude bar, without the white strip. The climb profile keeps its usual spacing.
I've tested this on my own Karoo, but not on every route or in landscape, so tell me if anything looks off. Thanks for reporting the download problem too. It was a typo in the listing file, and I've fixed it.
-
Oh my God! This new header feature with the 3 stats is awesome! Are you pulling these fields from the Karoo available fields library? If so, would it be easy enough to add even more choice? Just curious because if you could that'd be spectacular. Obviously not just needs to be done immediately....
Absolutely love it!
-
thanks, really glad you like it!
To answer your question: the header stats aren't pulled from the Karoo's field library. They come from the route data AltGraph already works out itself (the gradient under you, the visible stretch, and the route's total, remaining and covered distance). So the new dropdowns only choose between things AltGraph already knows.
Adding more choices is easy for anything AltGraph already calculates. Good candidates are:
- Remaining climbing (total ascent left)
- Estimated finish time
- Current elevation
- Distance to the next water or resupply point
- Climbing pace (m/h)
Live sensor data from the Karoo, such as heart rate, power or speed, is also possible, but it's more work. The extension would have to subscribe to those data streams, so I'd treat that as a second step.
I'm not promising a date, but I'll add the first group to the list for a future update. If you tell me which ones you'd use most, I'll put those first.
Please sign in to leave a comment.
Comments
101 comments